- Analytics
- News and Tools
- Market News
- EUR/USD Price Analysis: Tests the upper boundary around the level of 1.0800
EUR/USD Price Analysis: Tests the upper boundary around the level of 1.0800
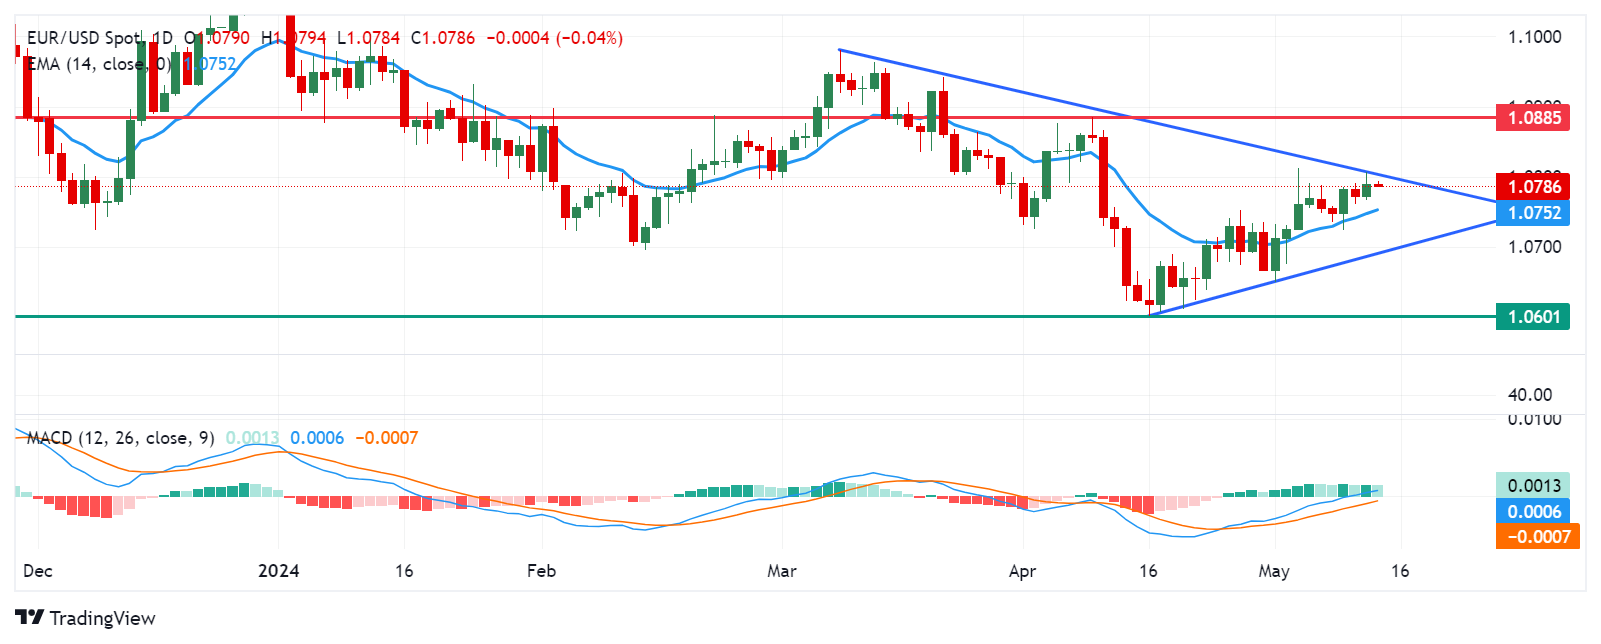
- EUR/USD could test the upper boundary of the symmetrical triangle.
- Breaking above the upper boundary could potentially shift momentum toward a bullish trend.
- A breach below the 14-day EMA at 1.0752 could prompt the pair to test the psychological threshold of 1.0700.
EUR/USD has recovered its recent gains registered in the previous session, trading around 1.0780 during the Asian session on Tuesday. From a technical perspective, analysis indicates a sideways trend for the pair as it continues to lie within the symmetrical triangle. A surpassing of the upper boundary could shift the momentum toward a bullish trend.
However, the momentum indicator Moving Average Convergence Divergence (MACD) indicates an upward momentum for the EUR/USD pair. While it is positioned above the centerline, there is a divergence observed above the signal line. If the signal line crosses over the centerline, it would reinforce the bullish sentiment.
The EUR/USD pair faces an immediate barrier at the upper boundary of the symmetrical triangle aligned with the psychological level of 1.0800. A break above this level could support the pair to test April’s high of 1.0885.
On the downside, key support for the EUR/USD pair is anticipated around the 14-day Exponential Moving Average (EMA) at 1.0752. A break below the latter could lead the pair to navigate the region around the psychological threshold of 1.0700, coinciding with the lower boundary of the symmetrical triangle around the level of 1.0690. Further support levels may emerge around April’s low at 1.0601.
EUR/USD: Daily Chart


© 2000-2026. All rights reserved.
This site is managed by Teletrade D.J. LLC 2351 LLC 2022 (Euro House, Richmond Hill Road, Kingstown, VC0100, St. Vincent and the Grenadines).
The information on this website is for informational purposes only and does not constitute any investment advice.
The company does not serve or provide services to customers who are residents of the US, Canada, Iran, The Democratic People's Republic of Korea, Yemen and FATF blacklisted countries.
Making transactions on financial markets with marginal financial instruments opens up wide possibilities and allows investors who are willing to take risks to earn high profits, carrying a potentially high risk of losses at the same time. Therefore you should responsibly approach the issue of choosing the appropriate investment strategy, taking the available resources into account, before starting trading.
Use of the information: full or partial use of materials from this website must always be referenced to TeleTrade as the source of information. Use of the materials on the Internet must be accompanied by a hyperlink to teletrade.org. Automatic import of materials and information from this website is prohibited.
Please contact our PR department if you have any questions or need assistance at pr@teletrade.global.
transfers