- Analytics
- News and Tools
- Market News
- NZD/USD Price Analysis: Bears tighten their grip and present battle at around 0.6000
NZD/USD Price Analysis: Bears tighten their grip and present battle at around 0.6000
- The daily RSI and MACD indicate diminishing buying momentum as bulls struggle to gain further ground.
- The hourly indicators reveal that sellers have a slight upper hand ahead of the Asian session.
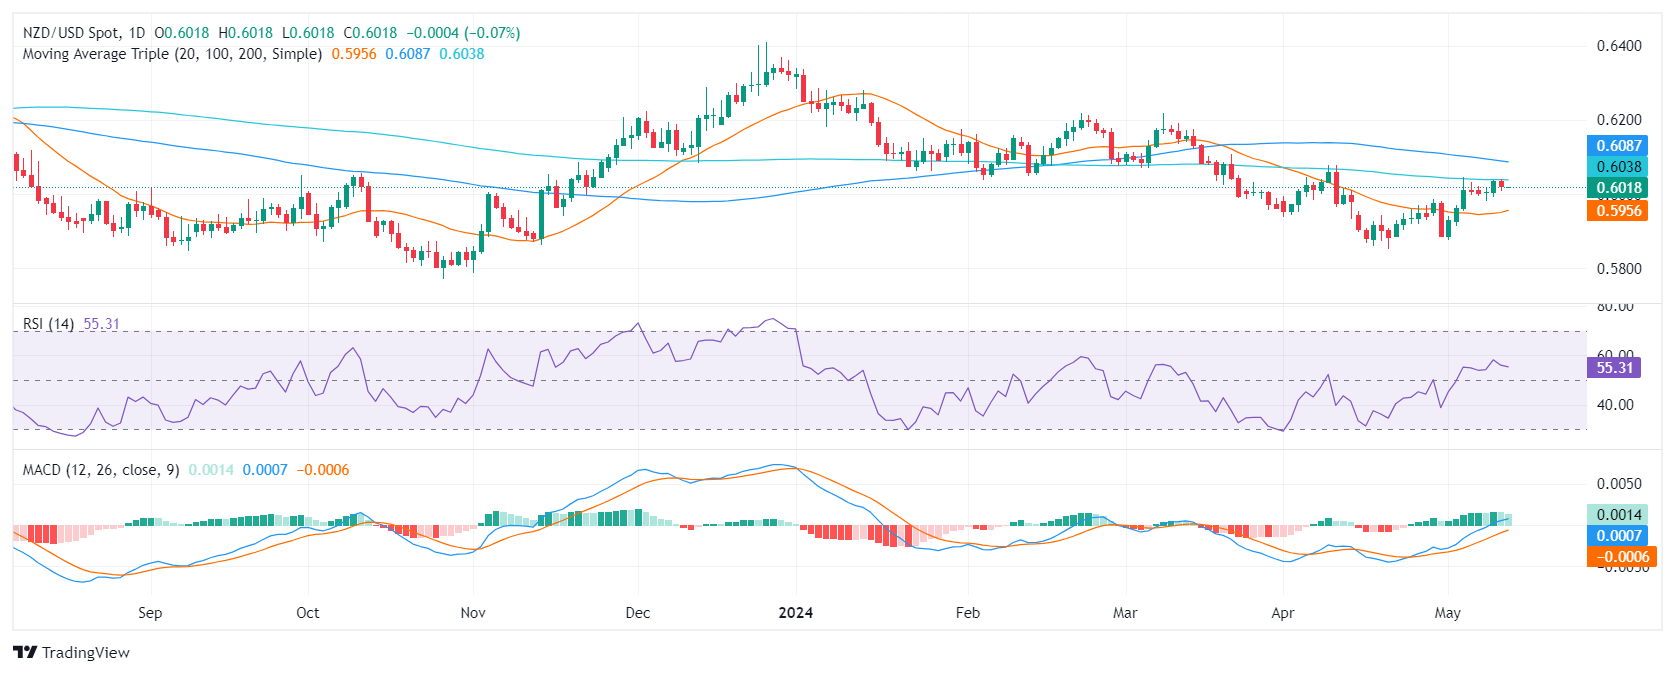
In Monday's session, the NZD/USD pair traded with mild losses, and sellers gained ground. As the pair is facing strong resistance at the 200-day Simple Moving Average (SMA), the pair struggles to consolidate advances. Indicators are flattening and indicate that the moment of the bulls may be coming to an end.
On the daily chart, the Relative Strength Index (RSI) shows a flattening traction above 50. At the same time, the Moving Average Convergence Divergence (MACD) histogram reveals a decrease in buying momentum, demonstrated by diminishing green bars.
NZD/USD daily chart
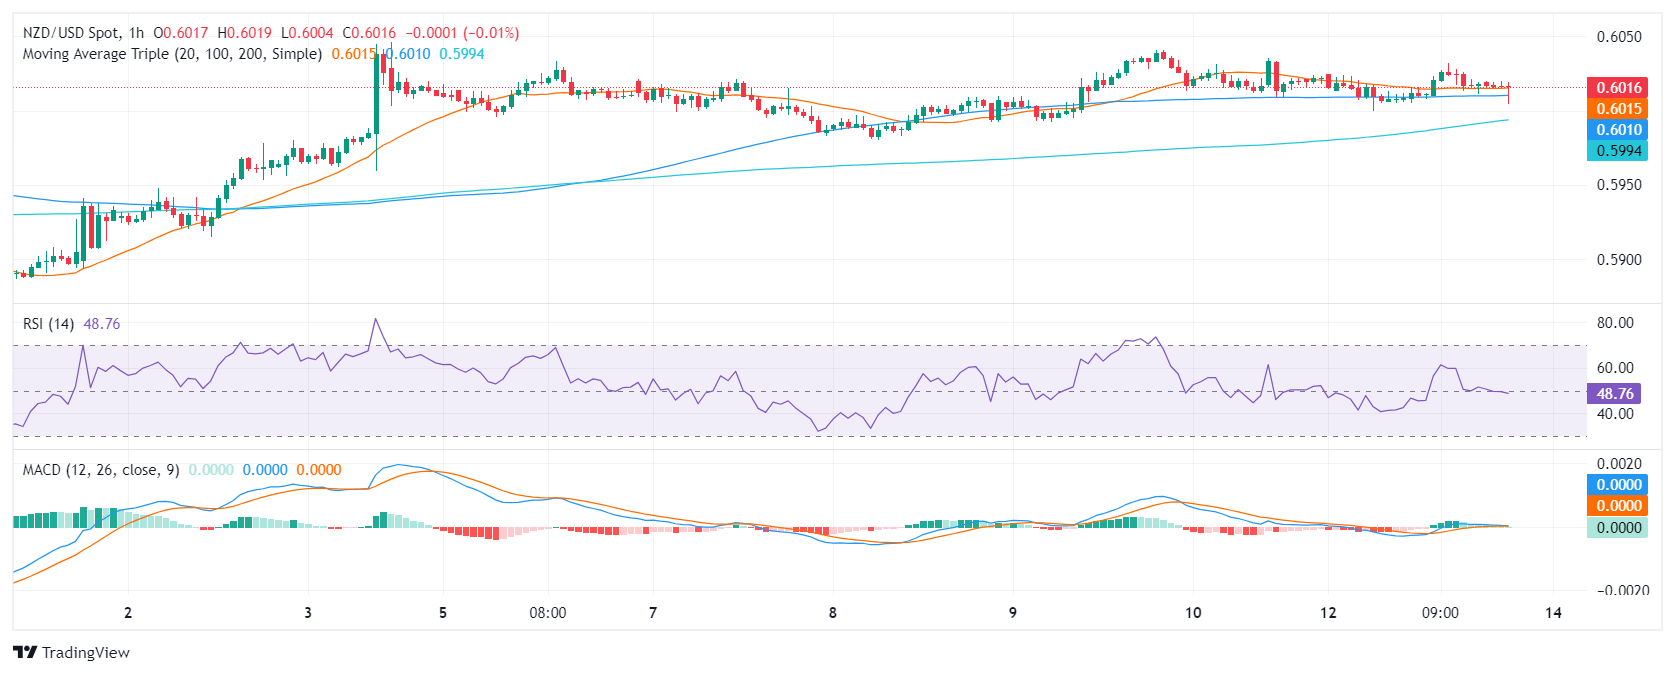
The hourly RSI indicates a slightly negative trend with the latest reading falling towards its middlepoint, showing a slight dominance from the sellers in the market. This is supported by the MACD, which also prints decreasing green bars, further confirming the decrease in buying momentum at an intraday level.
NZD/USD hourly chart
Interpreting the broader perspective, the NZD/USD is positioned below the thresholds of its 100, 200-day Simple Moving Averages (SMA). Significant bearish momentum, implying a prevailing downward trend in both the medium and long term. However, if the buyers defend the 20-day SMA, they may still have some hope to make another stride to reclaim the 200-day SMA.4


© 2000-2026. All rights reserved.
This site is managed by Teletrade D.J. LLC 2351 LLC 2022 (Euro House, Richmond Hill Road, Kingstown, VC0100, St. Vincent and the Grenadines).
The information on this website is for informational purposes only and does not constitute any investment advice.
The company does not serve or provide services to customers who are residents of the US, Canada, Iran, The Democratic People's Republic of Korea, Yemen and FATF blacklisted countries.
Making transactions on financial markets with marginal financial instruments opens up wide possibilities and allows investors who are willing to take risks to earn high profits, carrying a potentially high risk of losses at the same time. Therefore you should responsibly approach the issue of choosing the appropriate investment strategy, taking the available resources into account, before starting trading.
Use of the information: full or partial use of materials from this website must always be referenced to TeleTrade as the source of information. Use of the materials on the Internet must be accompanied by a hyperlink to teletrade.org. Automatic import of materials and information from this website is prohibited.
Please contact our PR department if you have any questions or need assistance at pr@teletrade.global.
transfers