- Analytics
- News and Tools
- Market News
- EUR/JPY Price Analysis: Bullish forces steering the market, minor pullbacks possible
EUR/JPY Price Analysis: Bullish forces steering the market, minor pullbacks possible
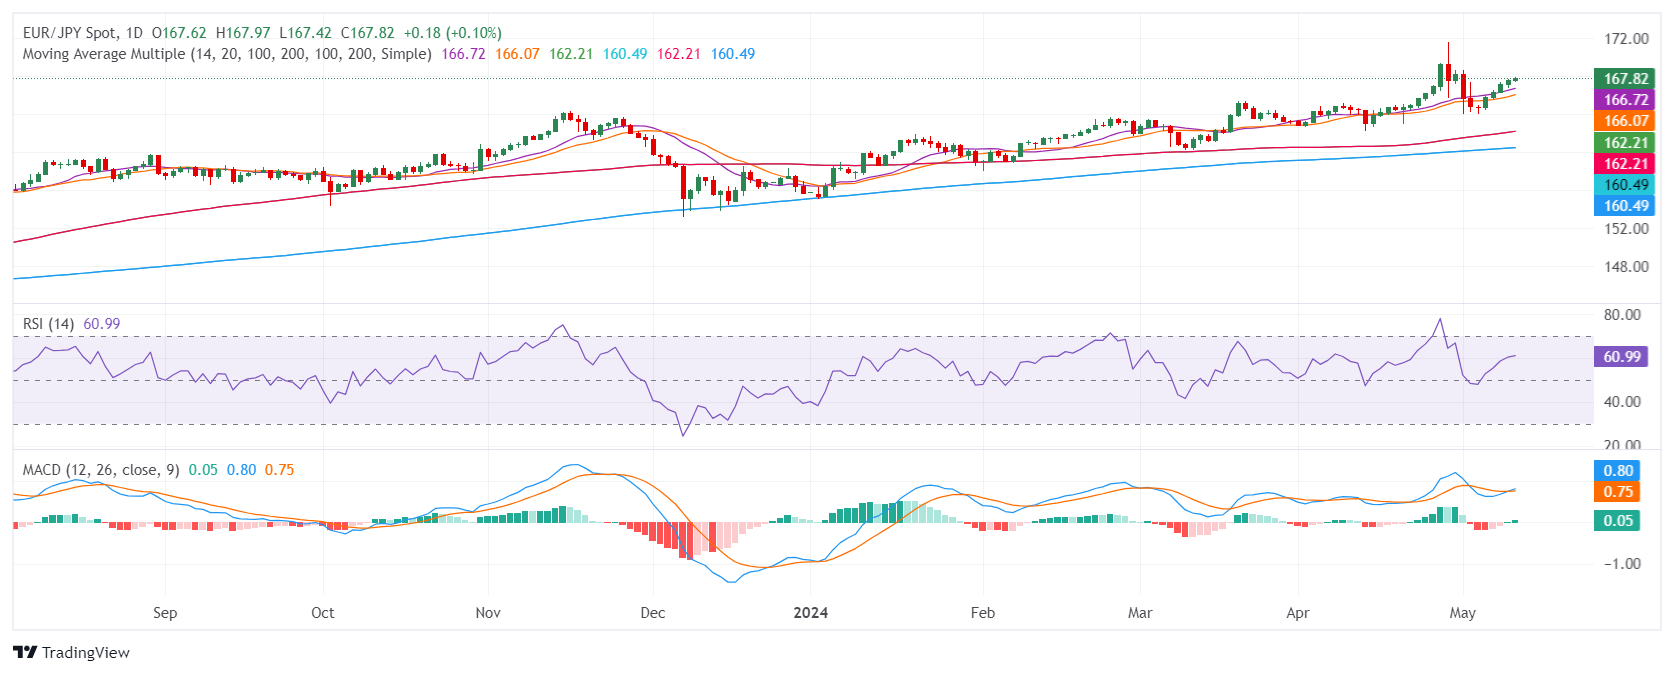
- The daily EUR/JPY RSI reveals ongoing bullish momentum, demonstrating a stable shift from 44 to 60 in the last sessions.
- Daily MACD perspectives align with the RSI, implying further progression of the positive momentum.
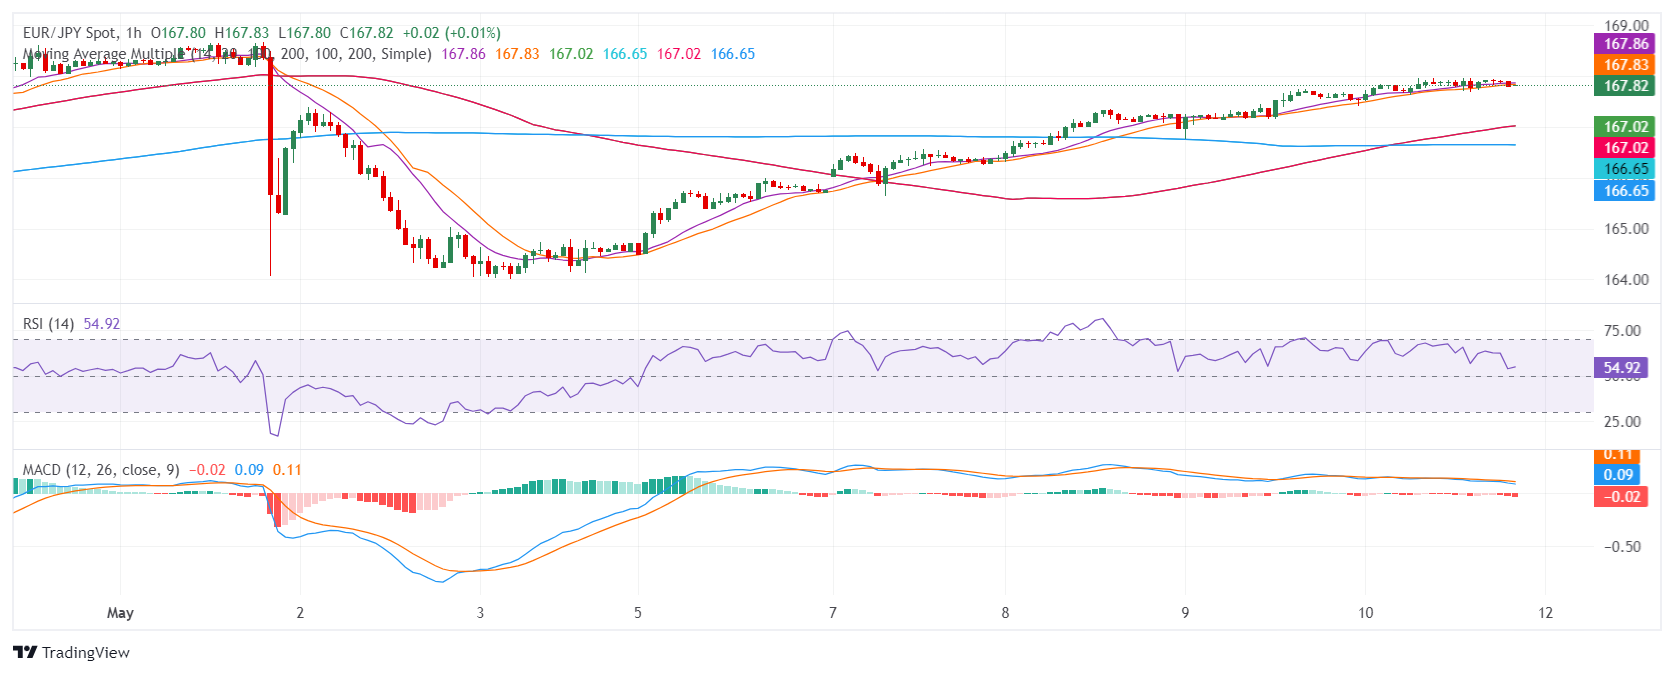
- Hourly chart shows a dip in RSI to 53 and indicates rising sellers' traction, suggesting a temporary pause in ongoing bullish momentum.
The EUR/JPY has been dominating with a steady bullish trend. It rose to 167.85 on Friday, reflecting a positive momentum primarily driven by market buyers. However, short-term sellers seem to be upping their game, implying potential transient pullbacks as indicators are flashing overbought signals in the hourly chart.
On the daily chart, the Relative Strength Index (RSI) for the EUR/JPY. A stable increase from since last week 44 to the current reading of 60 reveals an ongoing bullish momentum, primarily driven by market buyers. The Moving Average Convergence Divergence (MACD) corresponds with this perspective by showcasing rising green bars, indicating that the positive momentum is further progressing.
EURJPY daily chart
Looking at the hourly chart, the RSI presents a slight pullback to 53.26 after peaking at 67.40. While this indicates a potential slowing of buying dominance, the MACD, emphasized by rising red bars, suggests the formation of negative momentum. Despite the noticeable shift in the hourly chart, the dominant daily bullish outlook remains unchanged.
EURJPY hourly chart
In assessing the bigger picture, the EUR/JPY is positioned above its Simple Moving Averages (SMA) for the 20, 100, and 200-day periods which suggests that the buyers are clearly in command.


© 2000-2026. All rights reserved.
This site is managed by Teletrade D.J. LLC 2351 LLC 2022 (Euro House, Richmond Hill Road, Kingstown, VC0100, St. Vincent and the Grenadines).
The information on this website is for informational purposes only and does not constitute any investment advice.
The company does not serve or provide services to customers who are residents of the US, Canada, Iran, The Democratic People's Republic of Korea, Yemen and FATF blacklisted countries.
Making transactions on financial markets with marginal financial instruments opens up wide possibilities and allows investors who are willing to take risks to earn high profits, carrying a potentially high risk of losses at the same time. Therefore you should responsibly approach the issue of choosing the appropriate investment strategy, taking the available resources into account, before starting trading.
Use of the information: full or partial use of materials from this website must always be referenced to TeleTrade as the source of information. Use of the materials on the Internet must be accompanied by a hyperlink to teletrade.org. Automatic import of materials and information from this website is prohibited.
Please contact our PR department if you have any questions or need assistance at pr@teletrade.global.
transfers