- Analytics
- News and Tools
- Market News
- USD/CAD Price Analysis: Likely come out of contraction after US Inflation data, BoC policy decision
USD/CAD Price Analysis: Likely come out of contraction after US Inflation data, BoC policy decision
- USD/CAD consolidates below 1.3600 as the focus shifts to US Inflation and BoC monetary policy.
- The US inflation data could be made or a break for market expectations of Fed rate cuts in June.
- The BoC is expected to keep interest rates steady at 5%.
The USD/CAD pair struggles for a direction as investors await the United States Consumer Price Index (CPI) data for March, which will be published on Wednesday. The Loonie asset trades sideways below the round-level resistance of 1.3600 in Tuesday’s European session. The US inflation data for March is expected to provide some cues about when the Federal Reserve (Fed) could start reducing interest rates.
US annual headline inflation is forecasted to have increased to 3.4% from 3.2% in February. In the same period, the core inflation that excludes volatile food and energy prices is estimated to have dropped slightly to 3.7% from 3.8%.
Soft inflation figures could prompt speculation that the Fed will reduce borrowing costs after the June meeting, while hot figures might shift rate cut expectations to the second half of this year.
Meanwhile, the Canadian Dollar will dance to the tunes of the Bank of Canada’s (BoC) interest rate decision, to be announced on Wednesday. The BoC is expected to keep interest rates unchanged at 5%. Therefore, investors will focus on the outlook of borrowing rates. The BoC could deliver a dovish guidance as Canada’s labor market is facing stiff consequences of higher interest rates. Also, BoC’s preferred inflation measure, core CPI, came down to 2.1% in February.
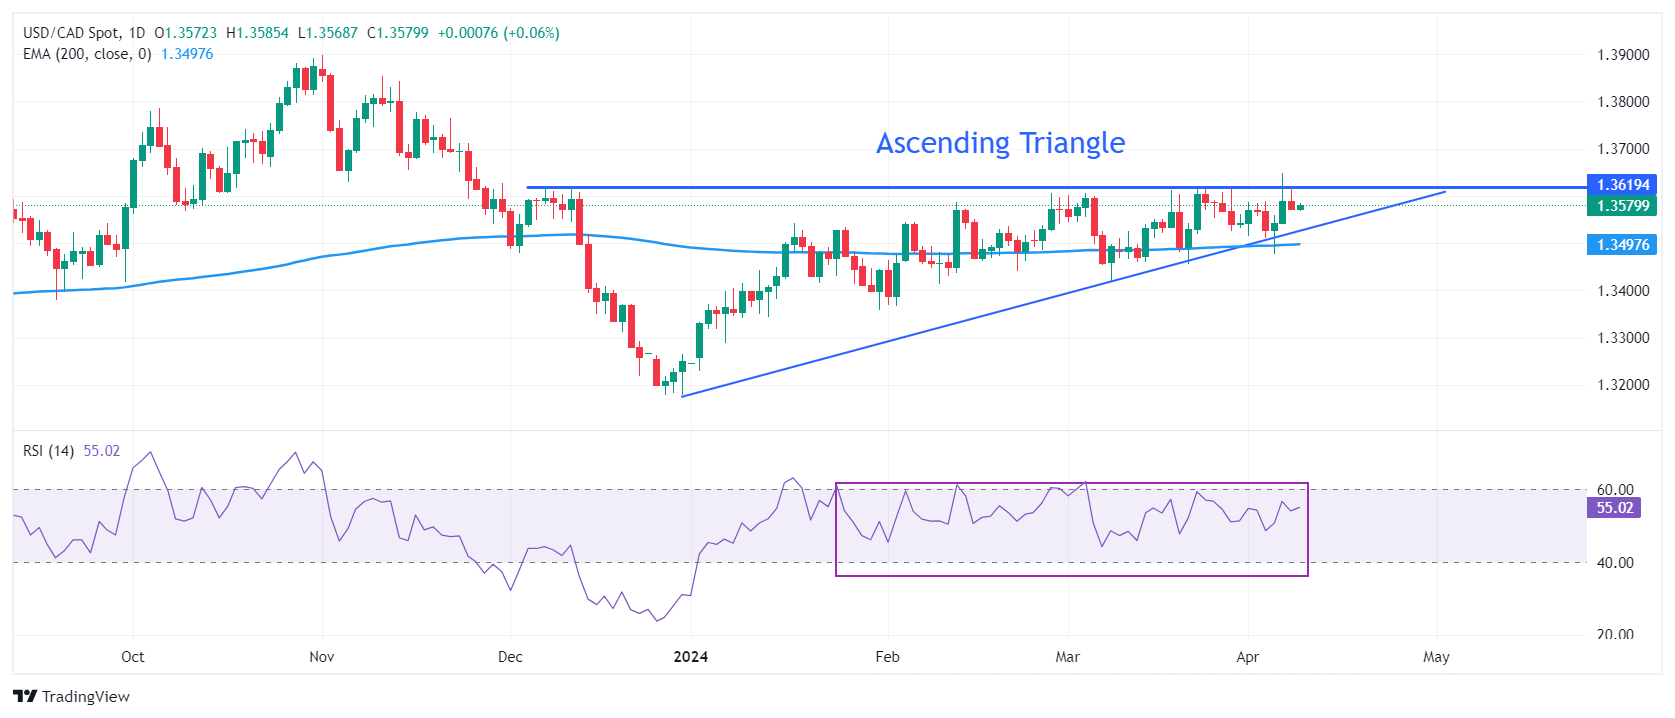
USD/CAD is slightly down from the horizontal resistance of the Ascending triangle formation on a daily timeframe, plotted from December 7 high at 1.3620. The upward-sloping border of the aforementioned pattern is placed from December 27 low at 1.3177. The chart pattern exhibits a sharp volatility contraction and a breakout can happen in any direction.
The 200-day Exponential Moving Average (EMA) near 1.3500 remains a crucial support for the US Dollar bulls.
Meanwhile, the 14-period Relative Strength Index (RSI) oscillates inside the 40.00-60.00 range, indicating indecisiveness among market participants.
The Loonie asset would observe a fresh upside if it breaks above April 5 high at 1.3648. This will drive the asset to the round-level resistance of 1.3700, followed by November 22 high at 1.3765.
On the flip side, a downside move below February 22 low at 1.3441 would expose the asset to February 9 low at 1.3413. A breakdown below the latter would extend downside towards January 15 low at 1.3382.
USD/CAD daily chart
© 2000-2026. All rights reserved.
This site is managed by Teletrade D.J. LLC 2351 LLC 2022 (Euro House, Richmond Hill Road, Kingstown, VC0100, St. Vincent and the Grenadines).
The information on this website is for informational purposes only and does not constitute any investment advice.
The company does not serve or provide services to customers who are residents of the US, Canada, Iran, The Democratic People's Republic of Korea, Yemen and FATF blacklisted countries.
Making transactions on financial markets with marginal financial instruments opens up wide possibilities and allows investors who are willing to take risks to earn high profits, carrying a potentially high risk of losses at the same time. Therefore you should responsibly approach the issue of choosing the appropriate investment strategy, taking the available resources into account, before starting trading.
Use of the information: full or partial use of materials from this website must always be referenced to TeleTrade as the source of information. Use of the materials on the Internet must be accompanied by a hyperlink to teletrade.org. Automatic import of materials and information from this website is prohibited.
Please contact our PR department if you have any questions or need assistance at pr@teletrade.global.


