- Analytics
- News and Tools
- Market News
- Crude Oil extends rally, WTI crosses above $82.00
Crude Oil extends rally, WTI crosses above $82.00
- Crude Oil prices are continuing a bull run on Monday.
- WTI is breaking out on the bull side as supply constraint concerns weigh.
- US Crude Oil bids into its highest prices since November.
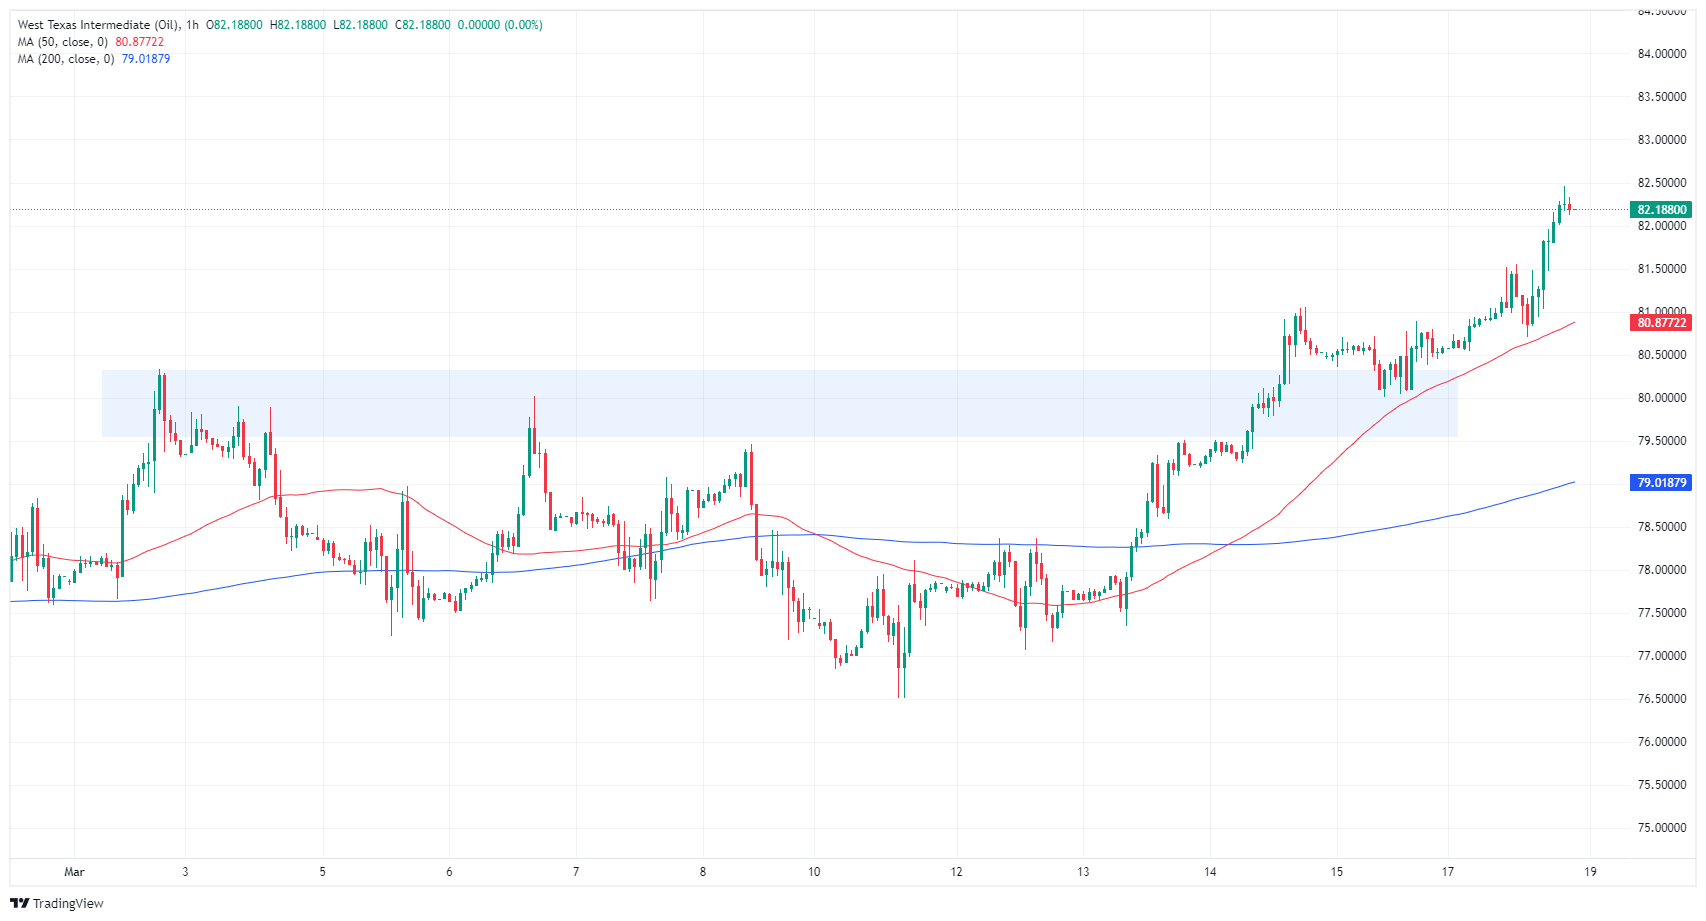
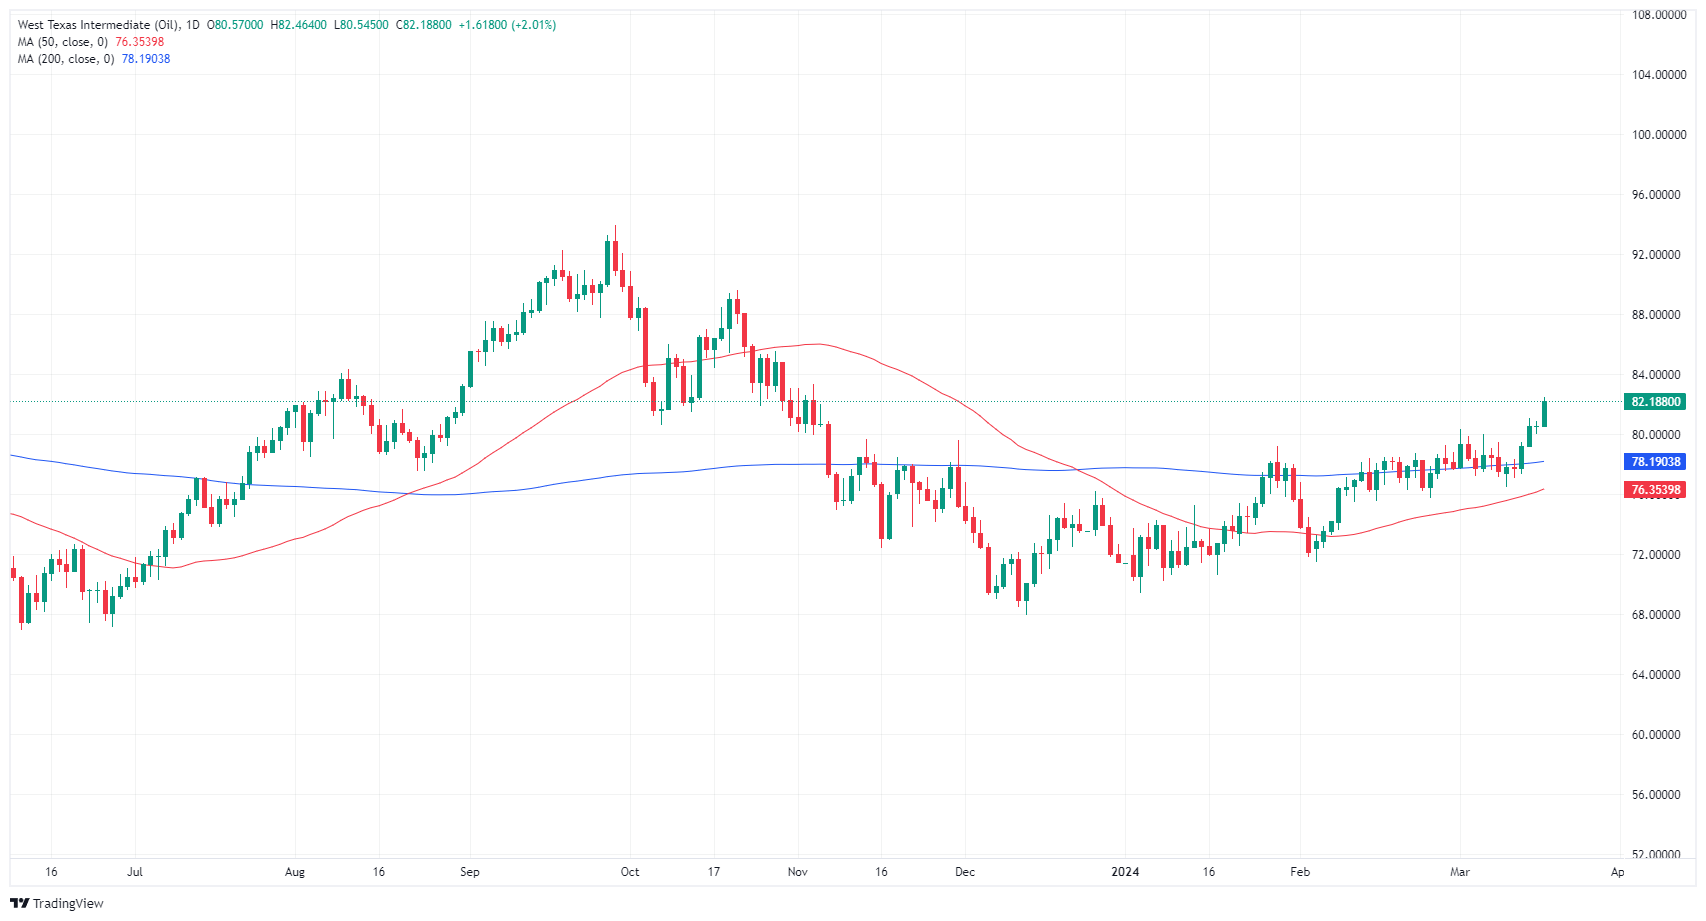
West Texas Intermediate (WTI) US Crude Oil climbed over $82.00 per barrel on Monday, extending a near-term bull. US Crude Oil tested its highest barrel prices since November, hitting a 16-week high of $82.46 to kick off the new trading week.
Energy markets are increasingly concerned that declining Crude Oil supplies will continue into the immediate future. Despite record oil pumping amounts from countries outside of the Organization of the Petroleum Exporting Countries (OPEC), specifically the US, Crude Oil markets are broadly expected to see a medium-term to long-term supply constraint, bumping barrel costs higher.
Weekly Crude Oil Stocks for the week ended March 15 from the American Petroleum Institute (API) are due Tuesday, and last showed a -5.5 million barrel drawdown. The Energy Information Administration’s (EIA) own Crude Oil Stocks Change is due Wednesday. The EIA’s barrel counts are expected to be further drawn down by a scant 25K barrels after the previous week’s decline of -1.5 million.
WTI technical outlook
Monday’s bullish bounce sees WTI trading above the $82.00 handle after catching a rebound from a previous supply zone near $80.00 per barrel. Crude Oil has gained nearly 7.5% from the last swing low below $77.00.
Monday’s bullish extension adds further topside momentum to a technical recovery on daily candlesticks after WTI US Crude Oil bottomed out near $67.85.
WTI hourly chart
WTI daily chart
© 2000-2026. All rights reserved.
This site is managed by Teletrade D.J. LLC 2351 LLC 2022 (Euro House, Richmond Hill Road, Kingstown, VC0100, St. Vincent and the Grenadines).
The information on this website is for informational purposes only and does not constitute any investment advice.
The company does not serve or provide services to customers who are residents of the US, Canada, Iran, The Democratic People's Republic of Korea, Yemen and FATF blacklisted countries.
Making transactions on financial markets with marginal financial instruments opens up wide possibilities and allows investors who are willing to take risks to earn high profits, carrying a potentially high risk of losses at the same time. Therefore you should responsibly approach the issue of choosing the appropriate investment strategy, taking the available resources into account, before starting trading.
Use of the information: full or partial use of materials from this website must always be referenced to TeleTrade as the source of information. Use of the materials on the Internet must be accompanied by a hyperlink to teletrade.org. Automatic import of materials and information from this website is prohibited.
Please contact our PR department if you have any questions or need assistance at pr@teletrade.global.


