- Analytics
- News and Tools
- Market News
- AUD/JPY declines following CPI data from Japan
AUD/JPY declines following CPI data from Japan
- The AUD/JPY is trading at 98.49, recording a 0.10% daily decline in Tuesday's session.
- The Japanese Yen is strengthening, propelled by an unexpected surge in Japan's January CPI data.
- Speculations of a shift in the Bank of Japan's hawkish policy are emerging, although disinflationary pressures persist.
The AUD/JPY pair is trading at 98.49, a minor 0.10% drop in Tuesday's session. This slight decline is observed amid the strengthening of the Japanese Yen, attributed to the surge in Japan's Consumer Price Index (CPI) during January.
In that sense, Japan's latest national CPI figures for January indicated a slight increase above expectations. The headline inflation rate was reported to have risen by 2.2% (YoY), against a forecast of 1.9%, and down from 2.6% in December. The core inflation rate, which excludes fresh food, was recorded at 2.0% YoY, meeting the expectations of 1.9% and a decrease from 2.3% in the previous month. Following the figures, both the JPY and the yields on Japanese Government Bonds (JGB) experienced an uptick, with the 2-year yield reaching its highest point since 2011 as markets renewed their hopes on a sooner liftoff of the Japanese banking authority. However, it's worth mentioning, that inflation is still trending downward, suggesting the Bank of Japan (BoJ) has room to maintain a cautious approach towards policy normalization. As for now, markets are gearing up for a liftoff in June, but the bank may delay it further.
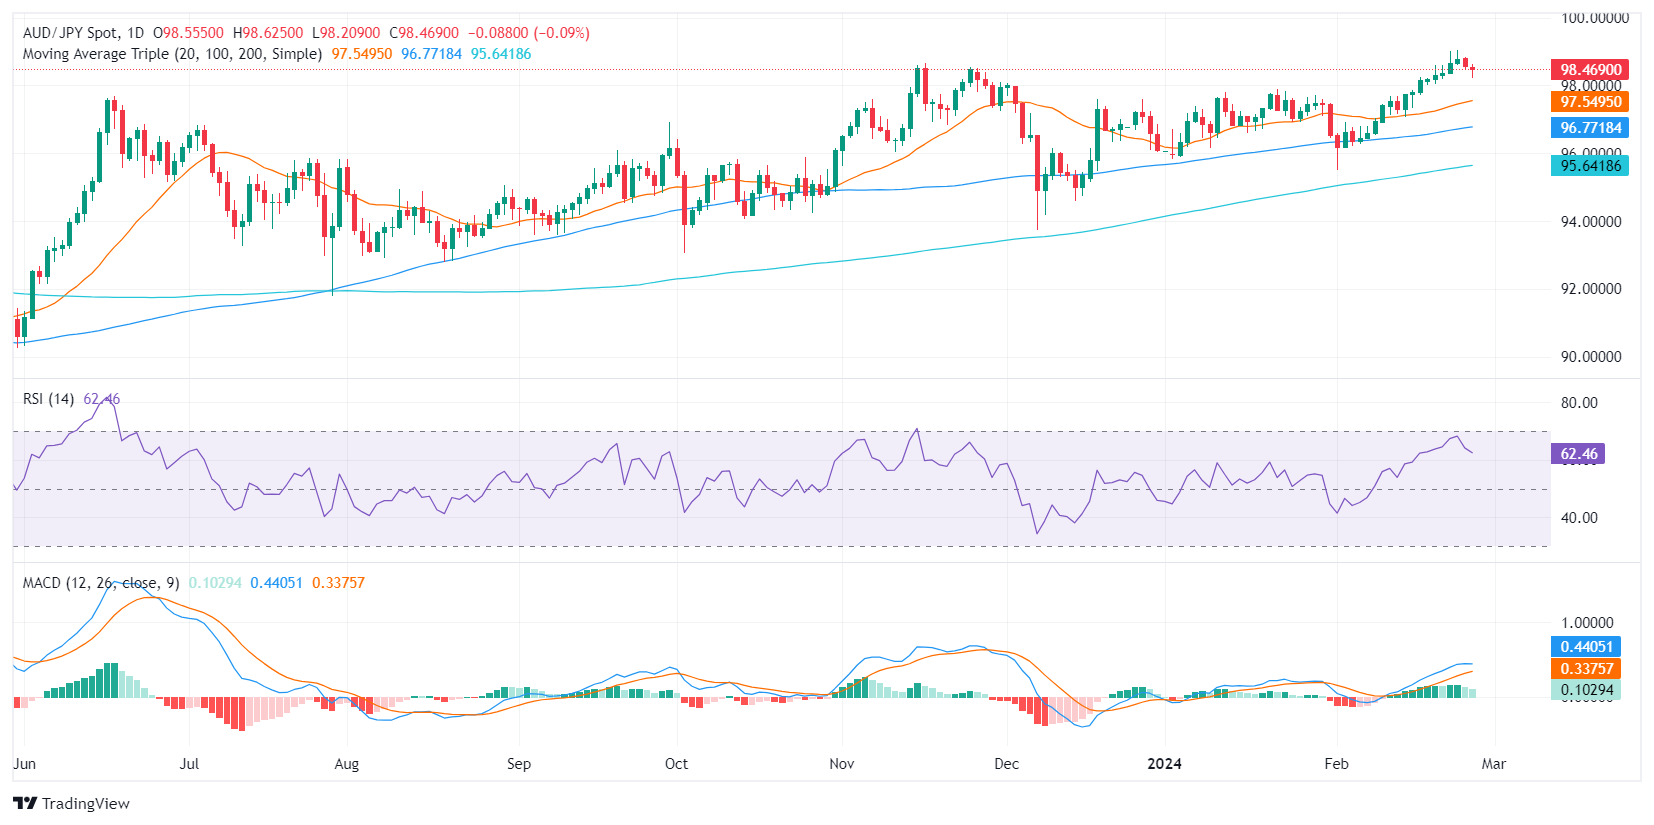
AUD/JPY technical analysis
On the daily chart, the Relative Strength Index (RSI) predominantly roams in positive territory, emphasizing a fair control of buyers over the market's direction. Despite some of its negative slope, the pair maintains its foothold in the positive zone, signaling that the bulls are still in charge.
Simultaneously, decreasing green bars on the Moving Average Convergence Divergence (MACD) histogram denotes a decline in positive momentum. Buyers, though active, are gradually losing ground, encouraging caution on the part of the bulls. However, the pair is still above its main Simple Moving Averages (SMAs) of 20,100, and 200 days, which suggests that the overall trend is still bullish, and the mentioned downward movements could be considered as a consolidation.
AUD/JPY daily chart

© 2000-2026. All rights reserved.
This site is managed by Teletrade D.J. LLC 2351 LLC 2022 (Euro House, Richmond Hill Road, Kingstown, VC0100, St. Vincent and the Grenadines).
The information on this website is for informational purposes only and does not constitute any investment advice.
The company does not serve or provide services to customers who are residents of the US, Canada, Iran, The Democratic People's Republic of Korea, Yemen and FATF blacklisted countries.
Making transactions on financial markets with marginal financial instruments opens up wide possibilities and allows investors who are willing to take risks to earn high profits, carrying a potentially high risk of losses at the same time. Therefore you should responsibly approach the issue of choosing the appropriate investment strategy, taking the available resources into account, before starting trading.
Use of the information: full or partial use of materials from this website must always be referenced to TeleTrade as the source of information. Use of the materials on the Internet must be accompanied by a hyperlink to teletrade.org. Automatic import of materials and information from this website is prohibited.
Please contact our PR department if you have any questions or need assistance at pr@teletrade.global.


