- Analytics
- News and Tools
- Market News
- Crude Oil extends rebound, WTI tests $78.20 after Chinese post-holiday demands picks up
Crude Oil extends rebound, WTI tests $78.20 after Chinese post-holiday demands picks up
- Crude Oil extended the week’s recovery.
- US API Weekly Crude Oil Stocks due later in the day.
- Energy markets are hoping for a boost in Chinese demand.
West Texas Intermediate (WTI) US Crude Oil climbed into a fresh high on Tuesday, extending the week’s technical recovery as energy markets lean into expectations of an uptick in Chinese Crude Oil after post-holiday travel caused increased purchases of Crude Oil.
Travel following the Chinese Lunar New Year was much higher than expected in the bottom half of February, causing Chinese Crude Oil inventories to decline faster than expected and pushing up the rate of purchases from Chinese refineries. China’s increase in spending and post-holiday Crude Oil consumption has sparked hopes across barrel markets that Chinese barrel demand will remain high enough to sop up extra capacity.
Maintenance halts are also expected this year in mainland China, where reduced refining capacity is expected to reach a three-year high, further constraining supply of refined oil products within China.
Chinese demand picks up, US API Crude Stocks expected
The American Petroleum Institute (API) is releasing its latest week-on-week US Crude Oil Stocks figures, which lasted printed a 7.8 million barrel increase in excess barrels floating around the US Crude Oil supply chains.
Energy markets are also shrugging off renewed expectations of a potential ceasefire in the ongoing Gaza conflict between Israel and Palestinian Hamas. Barrel traders remain concerned that the altercation could spill over into nearby Crude Oil-focused economies, risking supply chain disruptions in the Middle East.
WTI technical outlook
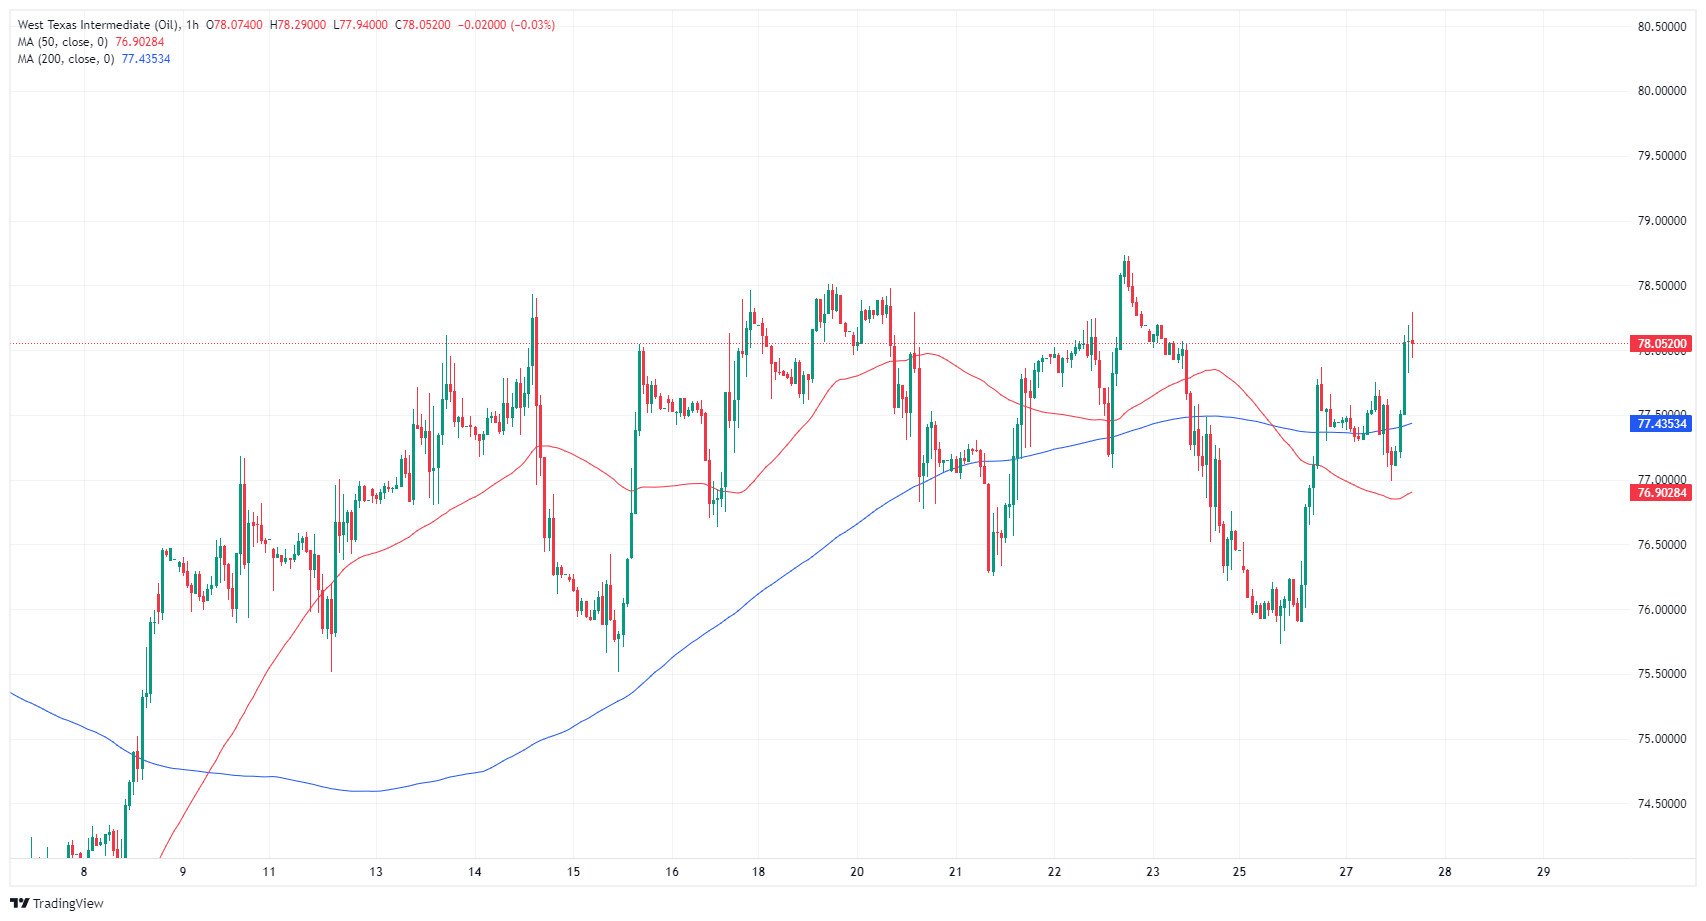
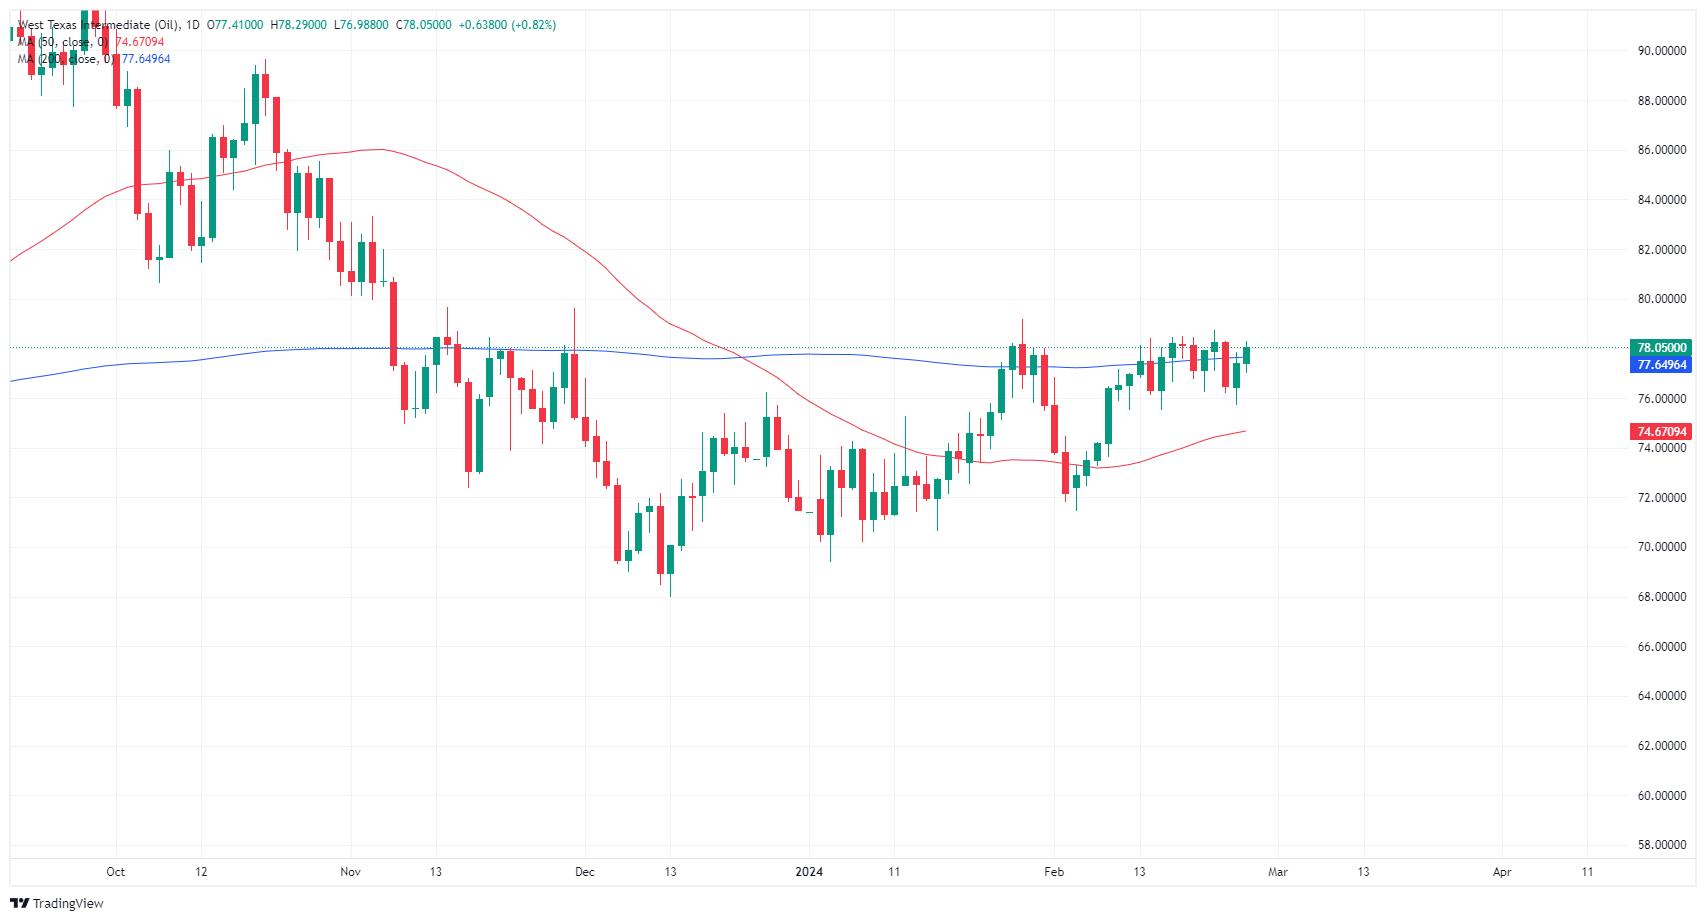
WTI once again climbed back into the $78.00 handle, testing $78.20 per barrel on Tuesday. US Crude Oil extended a rebound from Friday’s bottom near $75.80, and WTI continues to churn within rough consolidation between $78.40 and $76.00.
WTI remains mired in the 200-day Simple Moving Average (SMA) near $77.65, and near-term bullish momentum remains capped below January’s late peak at $79.20.
WTI hourly chart
WTI daily chart
© 2000-2026. All rights reserved.
This site is managed by Teletrade D.J. LLC 2351 LLC 2022 (Euro House, Richmond Hill Road, Kingstown, VC0100, St. Vincent and the Grenadines).
The information on this website is for informational purposes only and does not constitute any investment advice.
The company does not serve or provide services to customers who are residents of the US, Canada, Iran, The Democratic People's Republic of Korea, Yemen and FATF blacklisted countries.
Making transactions on financial markets with marginal financial instruments opens up wide possibilities and allows investors who are willing to take risks to earn high profits, carrying a potentially high risk of losses at the same time. Therefore you should responsibly approach the issue of choosing the appropriate investment strategy, taking the available resources into account, before starting trading.
Use of the information: full or partial use of materials from this website must always be referenced to TeleTrade as the source of information. Use of the materials on the Internet must be accompanied by a hyperlink to teletrade.org. Automatic import of materials and information from this website is prohibited.
Please contact our PR department if you have any questions or need assistance at pr@teletrade.global.


