- Analytics
- News and Tools
- Market News
- WTI tests $78.00 as Crude Oil continues rise, but headwinds are mounting
WTI tests $78.00 as Crude Oil continues rise, but headwinds are mounting
- WTI chalks in a seventh straight gain on Tuesday as geopolitical headlines remain.
- A bumper US CPI inflation print keeps barrel prices capped.
- US API Weekly Crude Stocks surged once again.
West Texas Intermediate (WTI) US Crude Oil climbed for a seventh consecutive day on Tuesday, testing the $78.00 per barrel price handle before settling near $77.40. Geopolitical tensions continue to keep Crude Oil bolstered, but an overhang in US crude supplies is weighing down energy markets, alongside a hotter-than-expected US Consumer Price Index (CPI) inflation print restraining investor sentiment.
US CPI inflation declines to 3.1% in January vs. 2.9% forecast
US CPI inflation came in higher and hotter than markets were hoping for, driving down money market expectations of a Federal Reserve (Fed) rate cut. The CME’s FedWatch Tool shows rate markets are now pricing in a first Fed rate trim in June, helping to keep oi barrel bids under pressure.
Geopolitics continue to be the main driver of Crude Oil upside momentum as a ceasefire in the Gaza conflict appears to be elusive, and the Russia-Ukraine conflict continues to slow burn on Eastern European markets as sanctions weigh on Russian Crude Oil markets.
The US’ American Petroleum Institute’s (API) weekly barrel counts showed a surprise buildup of 8.52 million barrels in the US Crude Oil supply stream, a much higher buildup than the forecast 2.6 million barrels. It is the largest buildup of US Crude Oil since the API’s mid-November barrel counts print.
WTI technical outlook
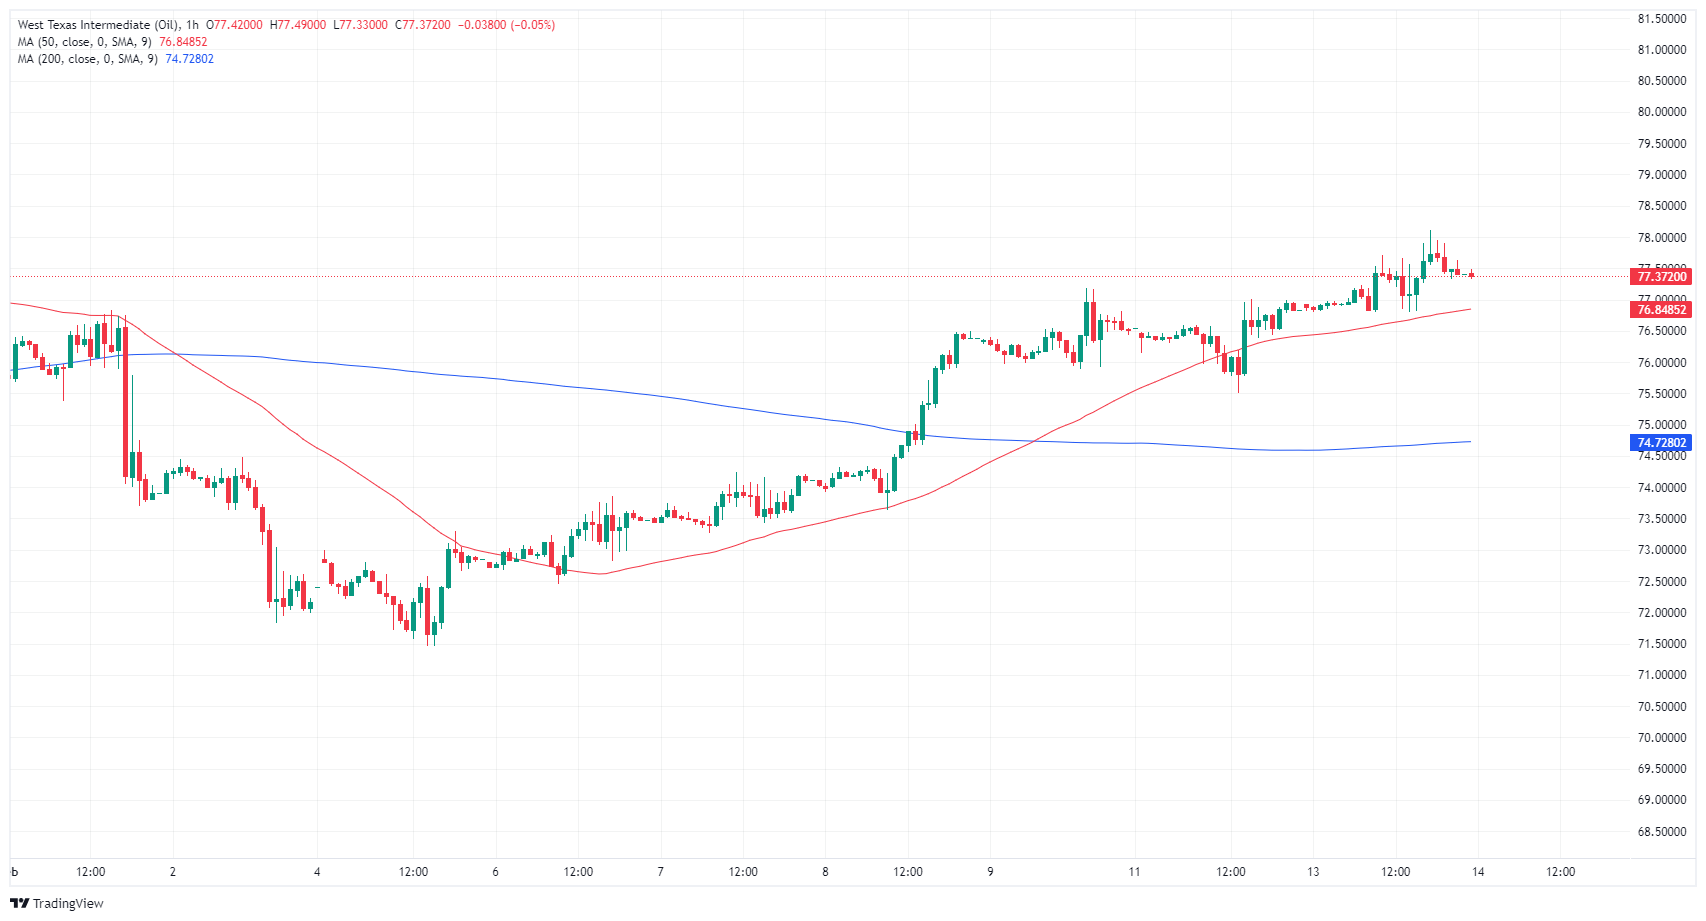
Near-term momentum in WTI US Crude Oil remains firmly bullish, with intraday action trading well above the 200-hour Simple Moving Average (SMA) near $74.72. WTI has traded north of the 200-hour SMA since crossing over the median technical barrier last week, and the near-term technical ceiling sits at Tuesday’s failed breach of the $78.00 handle.
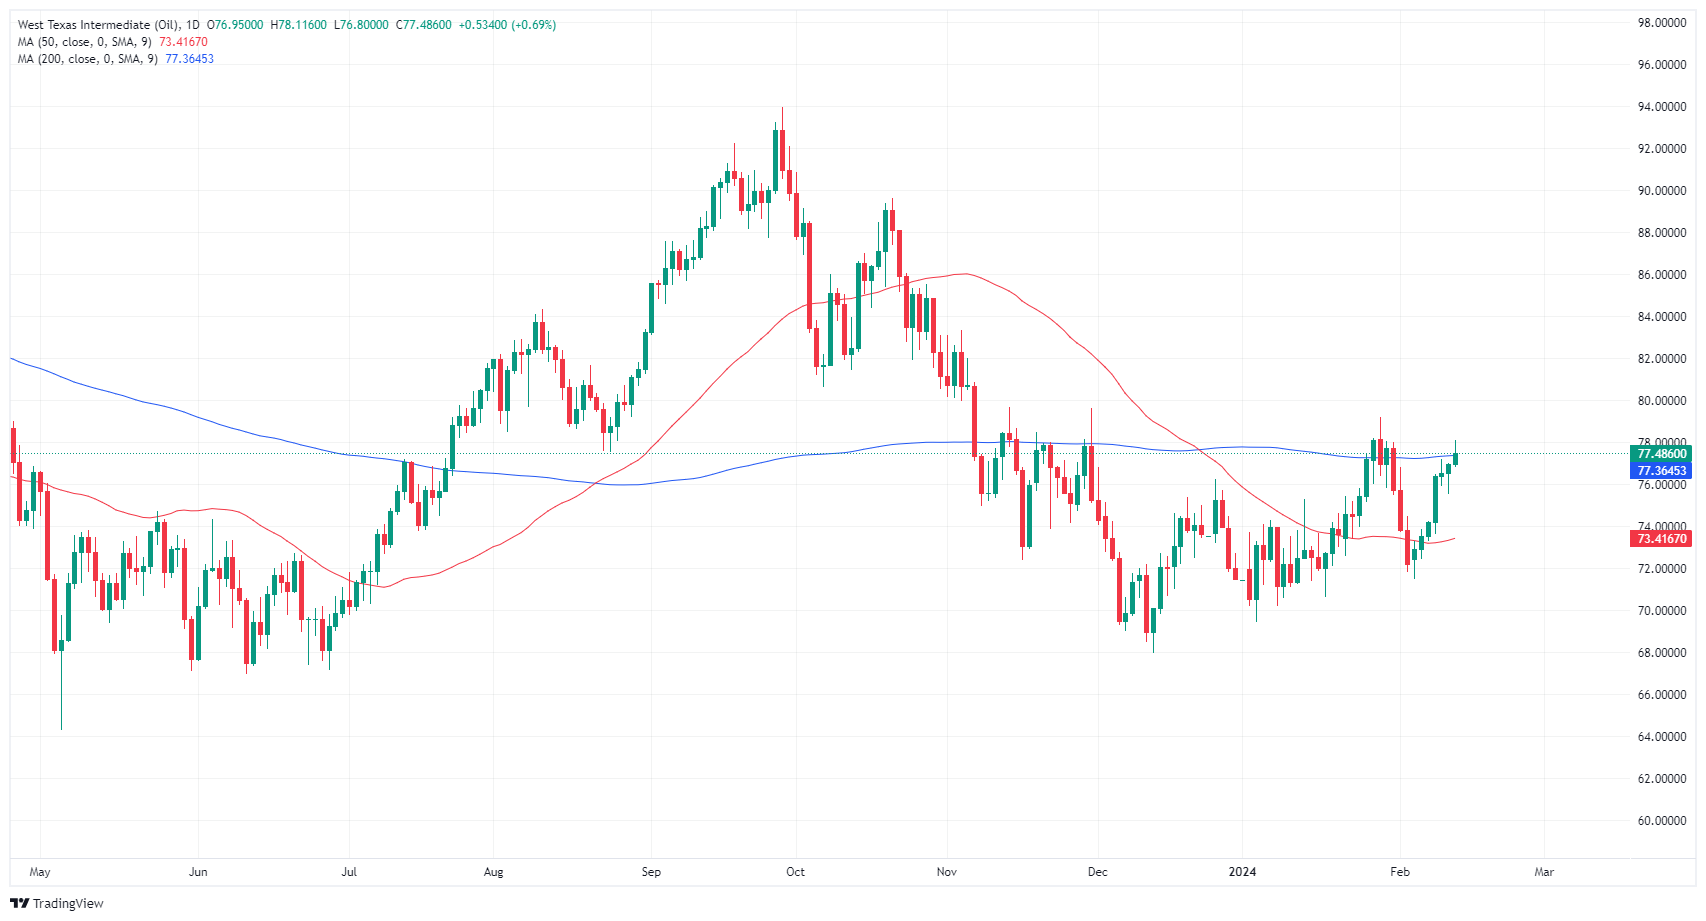
Tuesday’s bullish push left WTI overextended into the 200-day SMA priced in near $77.36, and a failed bullish climb over the key technical indicator will leave WTI bids exposed to an extended backslide into early February’s bottom bids near $72.00.
WTI hourly chart
WTI daily chart
© 2000-2026. All rights reserved.
This site is managed by Teletrade D.J. LLC 2351 LLC 2022 (Euro House, Richmond Hill Road, Kingstown, VC0100, St. Vincent and the Grenadines).
The information on this website is for informational purposes only and does not constitute any investment advice.
The company does not serve or provide services to customers who are residents of the US, Canada, Iran, The Democratic People's Republic of Korea, Yemen and FATF blacklisted countries.
Making transactions on financial markets with marginal financial instruments opens up wide possibilities and allows investors who are willing to take risks to earn high profits, carrying a potentially high risk of losses at the same time. Therefore you should responsibly approach the issue of choosing the appropriate investment strategy, taking the available resources into account, before starting trading.
Use of the information: full or partial use of materials from this website must always be referenced to TeleTrade as the source of information. Use of the materials on the Internet must be accompanied by a hyperlink to teletrade.org. Automatic import of materials and information from this website is prohibited.
Please contact our PR department if you have any questions or need assistance at pr@teletrade.global.


