- Analytics
- News and Tools
- Market News
- Gold Price Forecast: XAU/USD trades mildly lower and closes a losing week after US PCE figures
Gold Price Forecast: XAU/USD trades mildly lower and closes a losing week after US PCE figures
- The XAU/USD experiences a slight decrease, holding slightly above $2,018 with a minor pullback.
- Key indicators such as RSI and MACD demonstrate a subdued buying momentum, as bulls consolidate December’s rally.
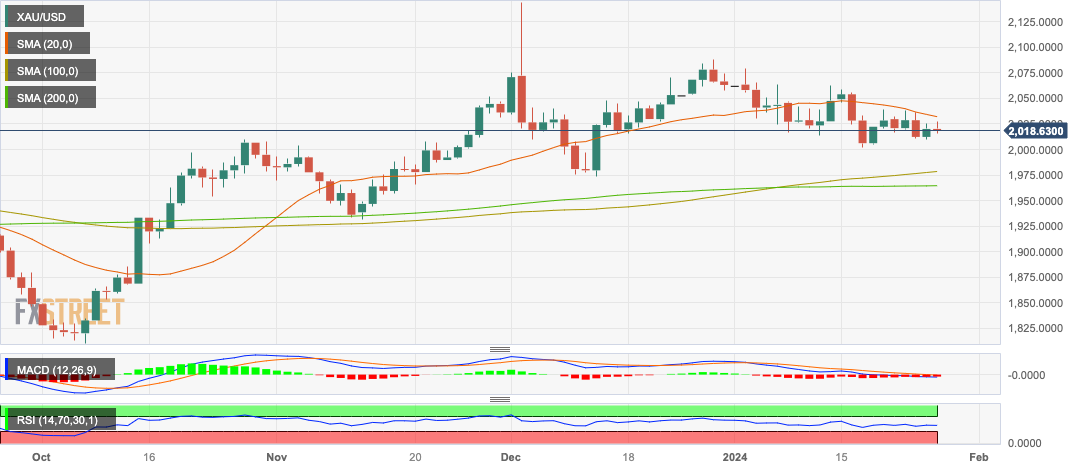
On Friday's session, the XAU/USD was seen trading at $2,018, presenting a slight decline of 0.08% and closing a 0.55% weekly loss. After reaching a level of $2,135 in December, buyers have been largely taking a pause, suggesting a neutral to a bullish outlook on the daily chart. Despite some momentum observed in the four-hour chart, the indicators remain relatively weak.
In addition, the USD recovery fueled by markets adjusting their bets on the Federal Reserve (Fed) due to the US economy showing resilience is pushing the metal lower. On Friday, soft Personal Consumption Expenditures (PCE) figures from December from the US didn’t fuel a significant reaction to the market expectations on the Fed which meets next week. As for now, markets pushed the start of the easing cycle to May from March but the Fed's tone may change those expectations.
XAU/USD levels to watch
The technical indicators on the daily chart, specifically the Relative Strength Index (RSI) and the position of the metal regarding its 20, 100, and 200 Simple Moving Averages (SMAs) paint a diverse picture. Despite the RSI showing a negative slope and currently residing in negative territory, the price manages to stay above the 20, 100, and 200-day SMAs. This is indicative of bullish standing in the broader time frame, and the recent pullback could be explained by the bulls taking a breather after pushing the price to a high of $2,135 in December.
Drilling down to the narrower four-hour chart, the momentum indicators present weak yet existent bullish undertones. The four-hour RSI shows a negative slope but is currently in positive territory, while the four-hour Moving Average Convergence Divergence (MACD) continues to produce flat red bars, again suggesting a hold on bearish momentum.
XAU/USD daily chart

© 2000-2026. All rights reserved.
This site is managed by Teletrade D.J. LLC 2351 LLC 2022 (Euro House, Richmond Hill Road, Kingstown, VC0100, St. Vincent and the Grenadines).
The information on this website is for informational purposes only and does not constitute any investment advice.
The company does not serve or provide services to customers who are residents of the US, Canada, Iran, The Democratic People's Republic of Korea, Yemen and FATF blacklisted countries.
Making transactions on financial markets with marginal financial instruments opens up wide possibilities and allows investors who are willing to take risks to earn high profits, carrying a potentially high risk of losses at the same time. Therefore you should responsibly approach the issue of choosing the appropriate investment strategy, taking the available resources into account, before starting trading.
Use of the information: full or partial use of materials from this website must always be referenced to TeleTrade as the source of information. Use of the materials on the Internet must be accompanied by a hyperlink to teletrade.org. Automatic import of materials and information from this website is prohibited.
Please contact our PR department if you have any questions or need assistance at pr@teletrade.global.


