- Analytics
- News and Tools
- Market News
- US equities mix on Wednesday as indexes risk a pullback
US equities mix on Wednesday as indexes risk a pullback
- US stocks spread in the mid-week, off of record highs.
- Tech stocks dragged higher as markets await Thursday’s economic data.
- Early earnings glee proved temporary after US PMI beats threaten Fed rate cut hopes.
US equity indexes came in mixed on Wednesday with the Dow Jones Industrial Average (DJIA) shedding almost a hundred points while the NASDAQ 100 saw a boost from another tech sector ramp-up fueled by chipmakers, while the Standard & Poor’s 500 (SP500) major index saw a thin gain into a fourth straight record close.
The early US session kicked off with earnings optimism in US equities, but hope quickly cooled after the US Purchasing Managers’ Index (PMI) for January outran market forecasts, trimming odds of a Federal Reserve (Fed) rate cut coming sooner rather than later. The US Manufacturing PMI component printed at a 15-month high, returning to expansionary territory above the 50.0 level, coming in at 50.3 compared to the forecast steady hold at 47.9. The Services PMI also printed above expectations at 52.9 versus the forecast backslide from 51.4 to 51.0.
Investors are now pivoting to face heavy data due in the back half of the trading week with Thursday’s US Gross Domestic Product (GDP) print forecast to shrink to 2% from 4.9% for the year ended in the fourth quarter, and Friday brings another round of Personal Consumption Expenditure (PCE) Price Index figures.
Friday’s PCE for December is expected to tick upwards slightly from 0.1% to 0.2%, while the annualized December PCE reading is forecast to come in at 3.0% compared to the previous period’s 3.2%.
The DJIA closed lower on Wednesday, shedding 99.06 points to close down 0.26% at $37,806.39 while the NASDAQ 100 climbed 55.97 points to close up 0.36% at $15,481.92.
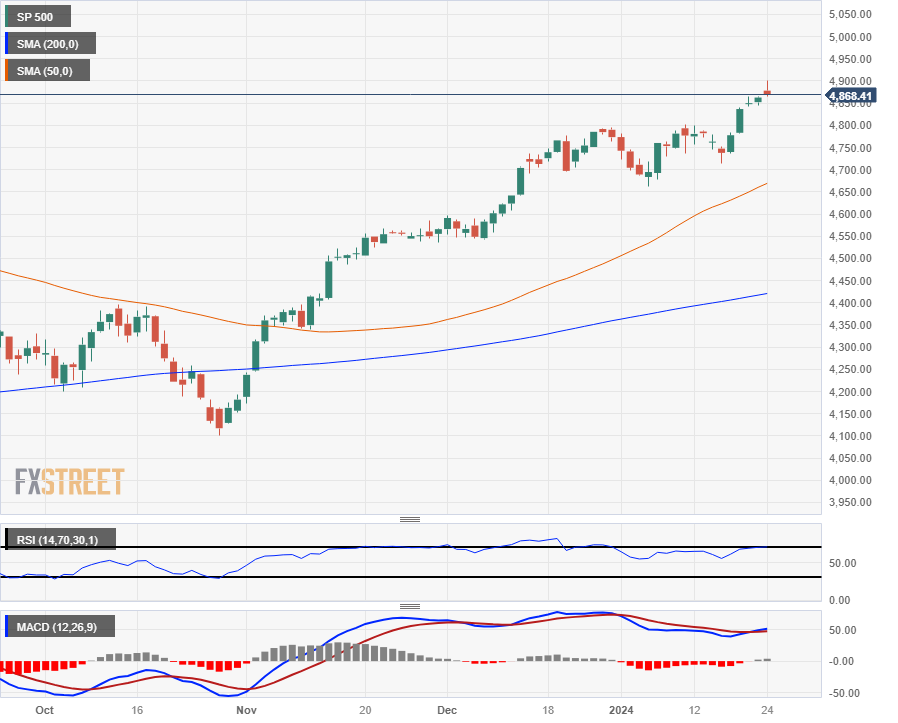
The S&P 500 saw thin gains, climbing a scant 3.95 points to end the day at a new record high close of $4,868.55, up 0.08% after hitting a new record high above the $4,900.00 handle.
S&P 500 Technical Outlook
The S&P 500 saw a late-day pullback after crossing the $4,900.00 handle for the first time ever, heading lower into the overnight session after wrapping up the US session at a fourth straight record close.
The S&P 500 continues to trade well above near-term technical indicators into record chart territory, with the 50-day Simple Moving Average (SMA) and the 200-day SMA at $4,675.00 and $4,425.00 respectively.
S&P 500 Hourly Chart
S&P 500 Daily Chart
© 2000-2026. All rights reserved.
This site is managed by Teletrade D.J. LLC 2351 LLC 2022 (Euro House, Richmond Hill Road, Kingstown, VC0100, St. Vincent and the Grenadines).
The information on this website is for informational purposes only and does not constitute any investment advice.
The company does not serve or provide services to customers who are residents of the US, Canada, Iran, The Democratic People's Republic of Korea, Yemen and FATF blacklisted countries.
Making transactions on financial markets with marginal financial instruments opens up wide possibilities and allows investors who are willing to take risks to earn high profits, carrying a potentially high risk of losses at the same time. Therefore you should responsibly approach the issue of choosing the appropriate investment strategy, taking the available resources into account, before starting trading.
Use of the information: full or partial use of materials from this website must always be referenced to TeleTrade as the source of information. Use of the materials on the Internet must be accompanied by a hyperlink to teletrade.org. Automatic import of materials and information from this website is prohibited.
Please contact our PR department if you have any questions or need assistance at pr@teletrade.global.


