- Analytics
- News and Tools
- Market News
- EUR/GBP edges lower ahead of ECB decision
EUR/GBP edges lower ahead of ECB decision
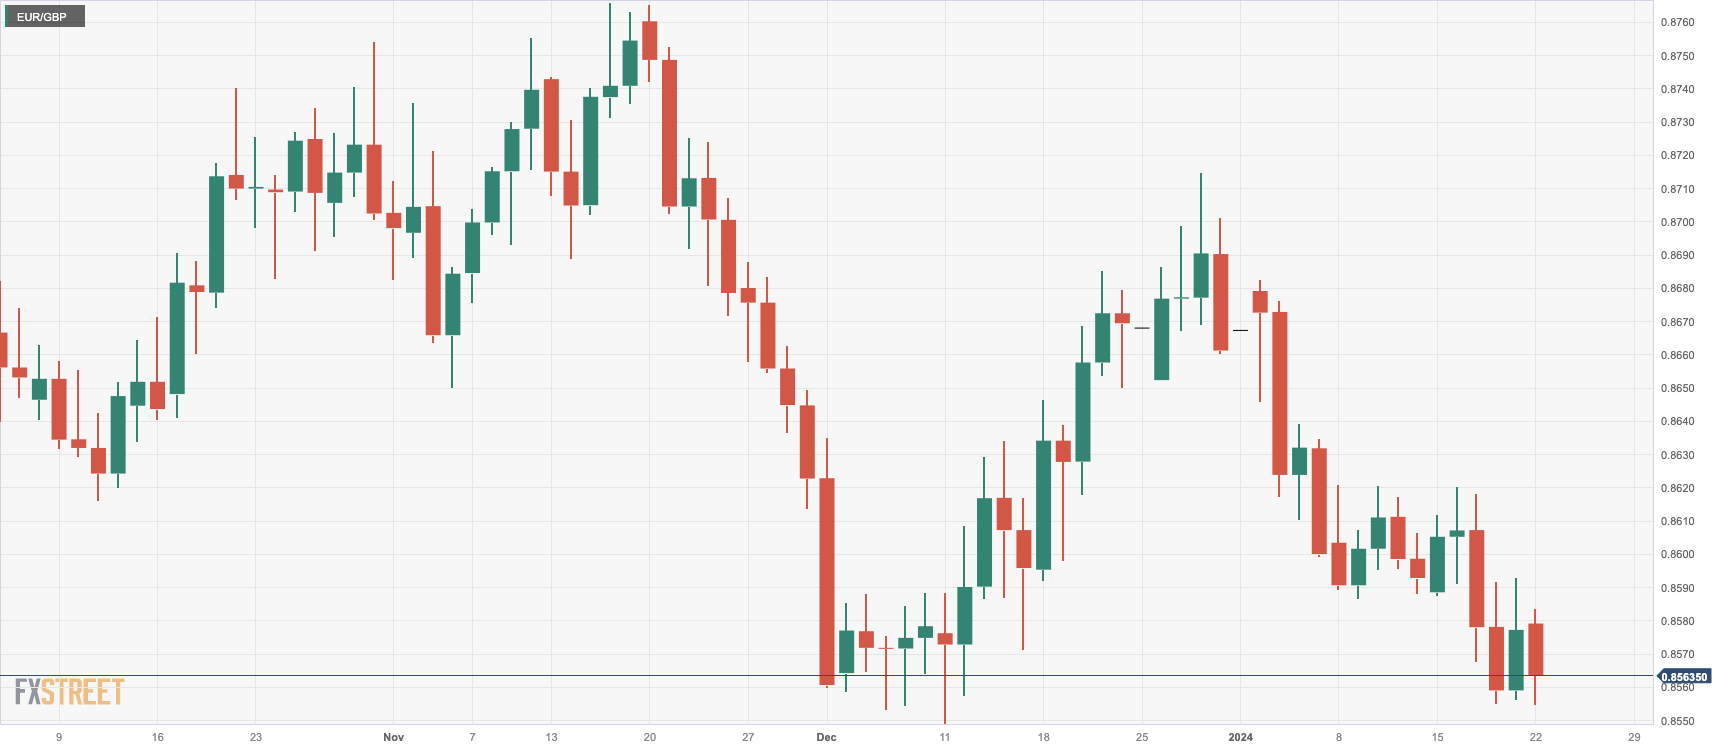
- The EUR/GBP records 0.20% losses standing at 0.8562.
- The ECB meets on Thursday, no policy change expected.
- Daily chart indicators present bearish sentiment: RSI indicates a negative slope in unfavorable territory with MACD's rising red bars hinting at a selling momentum.
On Monday's session, the EUR/GBP pair was seen trading at the 0.8562 level, depicting a 0.20% loss. The daily chart indicates a neutral to bearish outlook with bulls struggling to find solid ground. On the four-hour chart, indicators suggest a flattened momentum within negative territory, pointing to a domination of sellers over buyers. Overall, the Pound seems to have a slight command over the Euro mainly due to the British economy holding stronger than the majority of the EU countries and markets betting on a more dovish European Central Bank (ECB).
In that sense, markets are pricing in the European Central Bank to begin its rate cuts in Q2, with nearly 150 bp of total easing seen this year due to the latest round of weak economic data. On Thursday the ECB meets, were markets await the bank to hold its policy rate unchanged for the fourth consecutive time and investors will look for clues forward guidance, which may affect the crosses’s dynamics. As for the Bank of England (BoE), despite the relative robustness of the UK economy, market sentiments project the first rate cut in Q2, with approximately 125 bp of total rate cuts anticipated throughout the year.
EUR/GBP levels to watch
On the daily chart, the Relative Strength Index (RSI) is in a downward trajectory within the negative region, indicating an ongoing selling pressure. The positioning of the pair under the three key Simple Moving Averages (SMAs) - the 20, 100 and 200-day SMAs - corroborates this bearishness. This unfavorable climate is further solidified by the increasing red bars observed on the Moving Average Convergence Divergence (MACD) histogram.
Zooming into the four-hour chart, the indicators have stagnated within the negative arena, portraying a pause in the bearish momentum. The four-hour RSI is hovering flat in the negative space, yet the MACD histogram displays rising red bars. This suggests a lukewarm selling momentum, implying buyers yet have to exhibit concrete attempts to shift the scales.
EUR/GBP daily chart

© 2000-2026. All rights reserved.
This site is managed by Teletrade D.J. LLC 2351 LLC 2022 (Euro House, Richmond Hill Road, Kingstown, VC0100, St. Vincent and the Grenadines).
The information on this website is for informational purposes only and does not constitute any investment advice.
The company does not serve or provide services to customers who are residents of the US, Canada, Iran, The Democratic People's Republic of Korea, Yemen and FATF blacklisted countries.
Making transactions on financial markets with marginal financial instruments opens up wide possibilities and allows investors who are willing to take risks to earn high profits, carrying a potentially high risk of losses at the same time. Therefore you should responsibly approach the issue of choosing the appropriate investment strategy, taking the available resources into account, before starting trading.
Use of the information: full or partial use of materials from this website must always be referenced to TeleTrade as the source of information. Use of the materials on the Internet must be accompanied by a hyperlink to teletrade.org. Automatic import of materials and information from this website is prohibited.
Please contact our PR department if you have any questions or need assistance at pr@teletrade.global.


