- Analytics
- News and Tools
- Market News
- Crude Oil eases despite Red Sea tensions, WTI slips back towards $74.00
Crude Oil eases despite Red Sea tensions, WTI slips back towards $74.00
- WTI chipped lower as shipping continued through Red Sea despite new rebel attacks.
- Crude bids are eating away at last week’s gains as shipping lanes remain open.
- API, EIA stock figures slated for this week.
West Texas Intermediate (WTI) Crude Oil is easing back on Wednesday after last week’s 2%-plus gain on the back of transportation cancellations through the Red Sea following attacks on cargo ships by Iran-backed Houthi rebels in Yemen.
Houthi rebels have vowed to keep up the pace of attacks in the region, with Tuesday seeing an uptick in ship attacks, but logistics companies that previously suspended shipping lanes through the Yemen region of the Red Sea have returned to the area despite fresh attacks, sailing behind a joint task force that has settling into the region in an effort to quell rebel activity.
With Crude Oil production continuing to outpace declining barrel demand, even in the face of steepening production cuts from member states of the Organization of the Petroleum Exporting Countries (OPEC), and it’s organization of allies the OPEC+, Crude Oil continues to see stiff bearish pressure.
US Crude Oil stocks continue to flaunt expectations of declining reserves, and both the American Petroleum Institute (API) and the Energy Information Administration (EIA) will be publishing updated barrel buildup figures on Wednesday and Thursday, respectively.
The API Weekly Crude Oil Stocks count last posted a 939K barrel increase last week while the EIA Crude Oil Stocks Change last showed a buildup of nearly three million barrels, and is forecast to print a -2.6 million barrels reduction for the week ended December 22.
WTI Technical Outlook
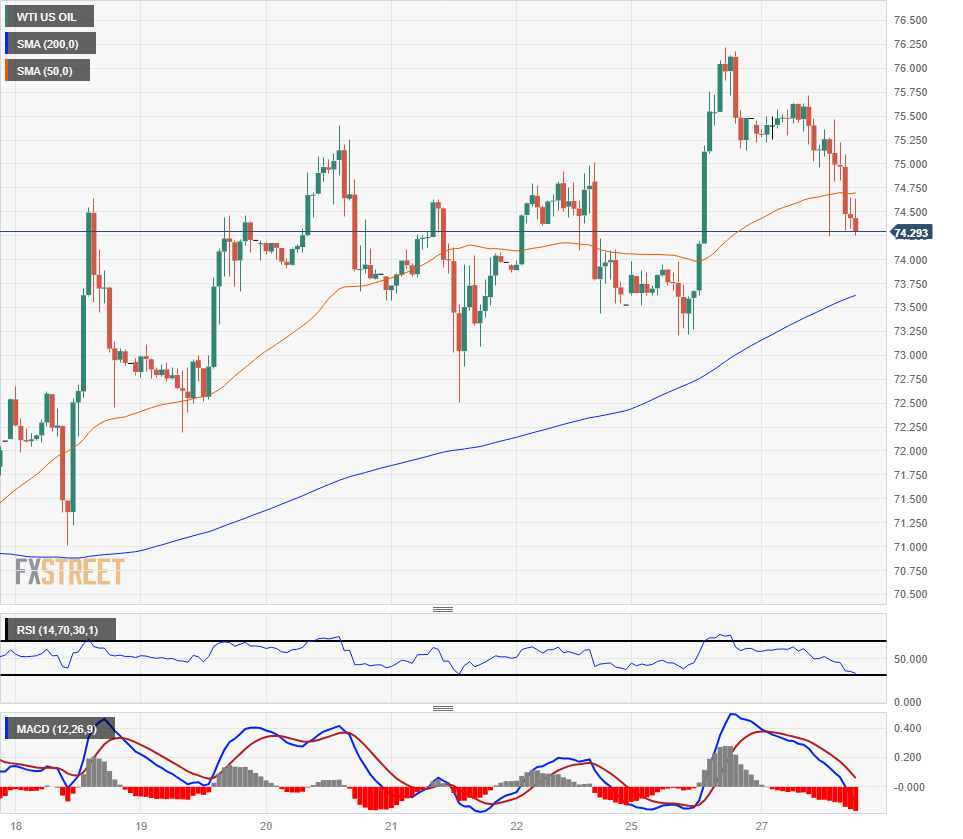
Near-term momentum continues to vex WTI, leeping prices pinned close to the 50-hour Simple Moving Average (SMA) as near-term bullish plays regularly run out of steam. US Crude Oil continues to trade on the north side of the 200-hour SMA, but the gap is closing quickly with the 200-day SMA rising into $73.50.
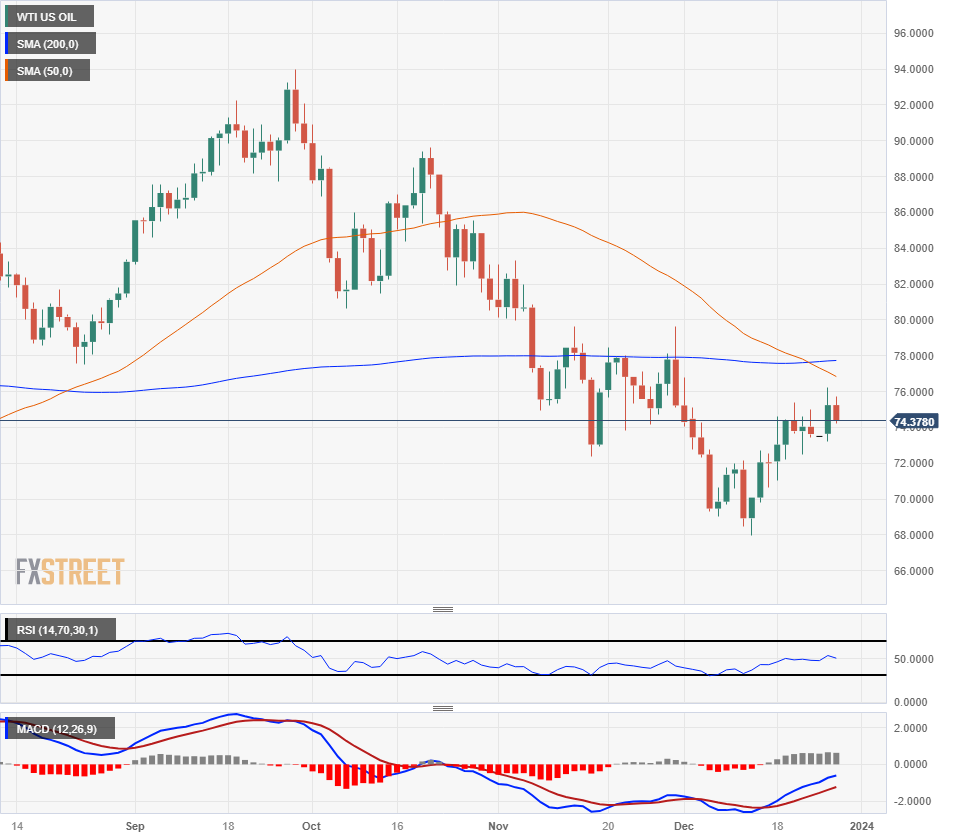
Oil bidders will be looking to gather enough steam to crach through the 200-day SMA currently floating near the $78.00 handle, while short sellers will note that WTI is approaching a technical confluence zone between familiar price peaks and a fresh bearish cross of the 50-day and 200-day SMAs just above $77.00.
WTI Hourly Chart

WTI Daily Chart

WTI Technical Levels
© 2000-2026. All rights reserved.
This site is managed by Teletrade D.J. LLC 2351 LLC 2022 (Euro House, Richmond Hill Road, Kingstown, VC0100, St. Vincent and the Grenadines).
The information on this website is for informational purposes only and does not constitute any investment advice.
The company does not serve or provide services to customers who are residents of the US, Canada, Iran, The Democratic People's Republic of Korea, Yemen and FATF blacklisted countries.
Making transactions on financial markets with marginal financial instruments opens up wide possibilities and allows investors who are willing to take risks to earn high profits, carrying a potentially high risk of losses at the same time. Therefore you should responsibly approach the issue of choosing the appropriate investment strategy, taking the available resources into account, before starting trading.
Use of the information: full or partial use of materials from this website must always be referenced to TeleTrade as the source of information. Use of the materials on the Internet must be accompanied by a hyperlink to teletrade.org. Automatic import of materials and information from this website is prohibited.
Please contact our PR department if you have any questions or need assistance at pr@teletrade.global.


