- Analytics
- News and Tools
- Market News
- EUR/USD flattening around 1.0750 ahead of hectic central bank schedule this week
EUR/USD flattening around 1.0750 ahead of hectic central bank schedule this week
- EUR/USD sticking close to 1.0750 ahead of the midweek's stiff central bank showings.
- US CPI inflation on the cards ahead of the Fed and the ECB.
- Rates expected to broadly hold, investors to be focused on hawkish versus dovish tone to statements.
The EUR/USD is seeing drift around the 1.0750 price level as markets gear up for a hectic trading week. Monday sees a thin schedule, but the week’s action will kick into high gear with Tuesday’s US Consumer Price Index (CPI), followed by Wednesday’s US Producer Price Index (PPI) and US Federal Reserve (Fed) rate call, as well as the European Central Bank (ECB)’s latest interest rate decision due on Thursday.
Tuesday’s US CPI inflation is expected to tick up in November from 0.0% to 0.1% will give markets something to chew on with the YoY figure expected to tick down from 3.2% to 3.1%.
Wednesday’s US PPI for November is expected to improve from -0.5% to a slim 0.1%, but the market focus will be squarely on the US Fed, which delivers its latest Interest Rate Decision at 19:00 GMT.
The Fed will also be releasing its latest Interest Rate Projections, and investors will be diving into the Fed’s Dot Plot to try and adjust their positioning as markets see the Fed finally pulling back on monetary policy and interest rates sometime early next year.
Thursday will round out the hefty data calendar with the ECB’s Monetary Policy Statement. The ECB is broadly expected to keep their Deposit Facility Rate at 4%, and markets will be trying to sniff out how hawkish or dovish the ECB is leaning in their latest Press Conference.
EUR/USD Technical Outlook
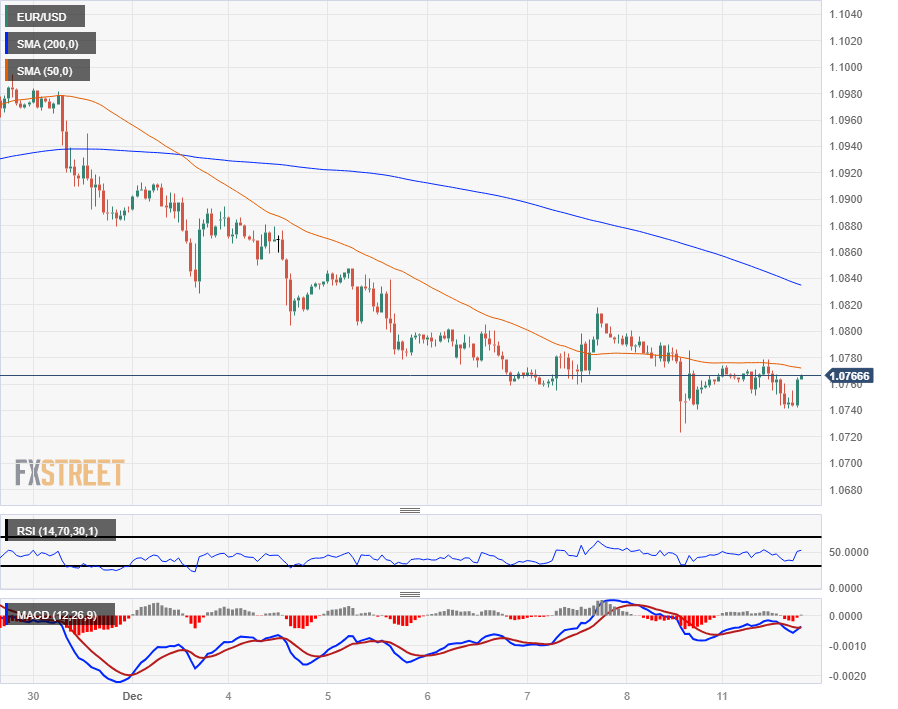
The EUR/USD is flattening on Monday, with the pair cycling the 1.0750 level. The EUR/USD has been trading sideways since slipping back below the 1.0800 handle last week in a short-lived risk bid.
Near-time action has been sticking close to the 50-hour Simple Moving Average (SMA), with any bullish recoveries capped by a descending 200-hour SMA near 1.0840.
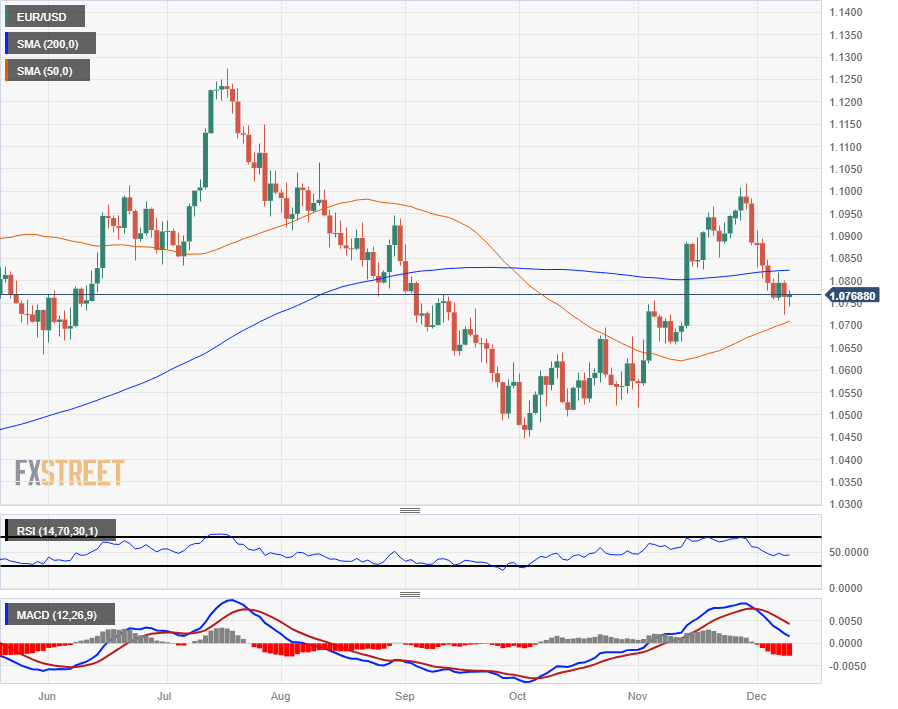
Daily candlesticks aren’t set to fare much better, with bids cycling near the 200-day SMA above 1.0800, and daily candles are currently constrained between the 50-day SMA justa bove 1.0700 and the 200-day SMA.
EUR/USD Hourly Chart

EUR/USD Daily Chart

EUR/USD Technical Levels
© 2000-2026. All rights reserved.
This site is managed by Teletrade D.J. LLC 2351 LLC 2022 (Euro House, Richmond Hill Road, Kingstown, VC0100, St. Vincent and the Grenadines).
The information on this website is for informational purposes only and does not constitute any investment advice.
The company does not serve or provide services to customers who are residents of the US, Canada, Iran, The Democratic People's Republic of Korea, Yemen and FATF blacklisted countries.
Making transactions on financial markets with marginal financial instruments opens up wide possibilities and allows investors who are willing to take risks to earn high profits, carrying a potentially high risk of losses at the same time. Therefore you should responsibly approach the issue of choosing the appropriate investment strategy, taking the available resources into account, before starting trading.
Use of the information: full or partial use of materials from this website must always be referenced to TeleTrade as the source of information. Use of the materials on the Internet must be accompanied by a hyperlink to teletrade.org. Automatic import of materials and information from this website is prohibited.
Please contact our PR department if you have any questions or need assistance at pr@teletrade.global.


