- Analytics
- News and Tools
- Market News
- Gold Price Analysis: XAU/USD softening ahead of impending RBA rate hike and China data
Gold Price Analysis: XAU/USD softening ahead of impending RBA rate hike and China data
- Spot Gold is settling back from $1,990 as US Treasury yields tick higher.
- Market sentiment is drawing tight in early Tuesday action with a 25 bps rate hike expected from RBA.
- China data also on the docket for Tuesday's early market session.
Gold prices went lower again on Monday, declining 0.75% into $1,977 as US Treasury yields stepped higher once more, pushing the XAU/USD back down after losing the $2,000 handle last Friday.
Gold has faced rejection from the $2,000 handle several times in two weeks, and a technical ceiling could be baking into the XAU/USD.
Tuesday kicks things off with a handful of China data on the economic calendar, to be followed by a broadly-expected 25 basis point rate hike from the Reserve Bank of Australia (RBA).
Australia Interest Rate Decision Preview: RBA set to tighten further after four straight meetings on hold
Before the RBA's forecast rate hike lands on markets, China Trade Balance data lands in the Aisa early Tuesday market session.
China's Exports and Imports are both expected to improve for the year into October; China YoY Exports are forecast to print at -3.1% compared to September's reading of -6.2%.
Meanwhile, annualized Imports for October are forecast to see much less upside, but still improve with a market median forecast of -5.4% compared to September's -6.2%.
With a firmer rebound on the cards for Exports, China's overall Trade Balance for the year into October is expected to print on the upside to $81.85B in US Dollar (USD) terms, compared to September's showing of $77.71B USD.
Forex Today: US Dollar looks vulnerable, RBA expected to raise rates
XAU/USD Technical Outlook
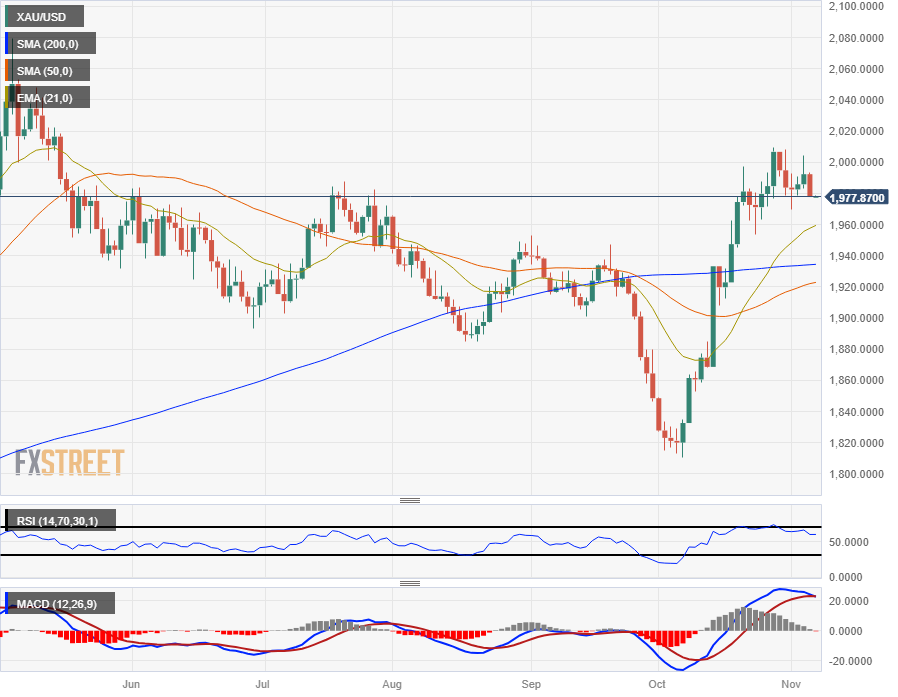
Spot Gold looks set to see a bearish correction on the daily candlesticks barring any bullish resurgence, with XAU/USD beginning to test further away from the $2,000 major handle with each rejection.
Gold bids are looking exhausted trading into seven-month highs, and technical indicators are beginning to flash warning signs of an impending bear move.
The Relative Strength Index (RSI) hit overbought conditions in the last week of October, while the Moving Average Convergence-Divergence (MACD) indicator is seeing a bearish rollover of the signal MA line.
Gold bids are facing potential overbought price levels, and technical support sits at the 200-day Simple Moving Average (SMA), currently grinding higher towards $1,940 and the 21-day Exponential Moving Average (EMA) seeing some lift into $1,960.
Near-term trend momentum appears to be struggling to catch up to both the long and short ends of the MA tails, with the 50-day SMA struggling to lift from the $1,920 level, below both the faster and slower MA lines.
XAU/USD Daily Chart

XAU/USD Technical Levels
© 2000-2026. All rights reserved.
This site is managed by Teletrade D.J. LLC 2351 LLC 2022 (Euro House, Richmond Hill Road, Kingstown, VC0100, St. Vincent and the Grenadines).
The information on this website is for informational purposes only and does not constitute any investment advice.
The company does not serve or provide services to customers who are residents of the US, Canada, Iran, The Democratic People's Republic of Korea, Yemen and FATF blacklisted countries.
Making transactions on financial markets with marginal financial instruments opens up wide possibilities and allows investors who are willing to take risks to earn high profits, carrying a potentially high risk of losses at the same time. Therefore you should responsibly approach the issue of choosing the appropriate investment strategy, taking the available resources into account, before starting trading.
Use of the information: full or partial use of materials from this website must always be referenced to TeleTrade as the source of information. Use of the materials on the Internet must be accompanied by a hyperlink to teletrade.org. Automatic import of materials and information from this website is prohibited.
Please contact our PR department if you have any questions or need assistance at pr@teletrade.global.


