- Analytics
- News and Tools
- Market News
- Gold Price Forecast: XAU/USD advances sligtly as the USD weakens and yields decline
Gold Price Forecast: XAU/USD advances sligtly as the USD weakens and yields decline
- XAU/USD advanced slightly to $1,985, seeing 0.15% gains.
- Short-term US Treasury yields are weak, near monthly lows.
- Eyes on Friday's Nonfarm Payrolls.
In Thursday's session, the XAU/USD Gold Spot price gained limited momentum, jumping to $1,985, benefited by lower US yields and a weaker US Dollar following Wednesday's Federal Reserve (Fed) decision.
Markets are confident that the Fed is approaching the end of its tightening cycle after Chair Powell highlighted that the bank covered significant ground and that for the next decisions, it will consider the tighter financial conditions and the cumulative effects of the tightening. As a reaction, US yields, often seen as the opportunity cost of holding Gold, sharply declined, which allowed the metal to gain some ground with the 2,5 and 10-year rates standing near monthly lows at 4.99%,4.64% and 4.66%. In addition, the hawkish bets on the Fed from December declined, with the swaps markets discounting only 20% chances of a 25 basis point hike which also added to the Greenback's weakness.
That being said, the US will report October's Nonfarm Payrolls on Friday, which are expected to follow last month's tendency, showing a decelerating job creation. Average Hourly Earnings are also seen decelerating while the Unemployment rate is forecasted to remain steady at 3.8%. It is worth noticing that a hot reading may revive the hawkish bets on the Fed as despite welcoming the recent data which showed a cooling in the sector, the bank clarified that it is ready to adjust further in case needed.
XAU/USD Levels to watch
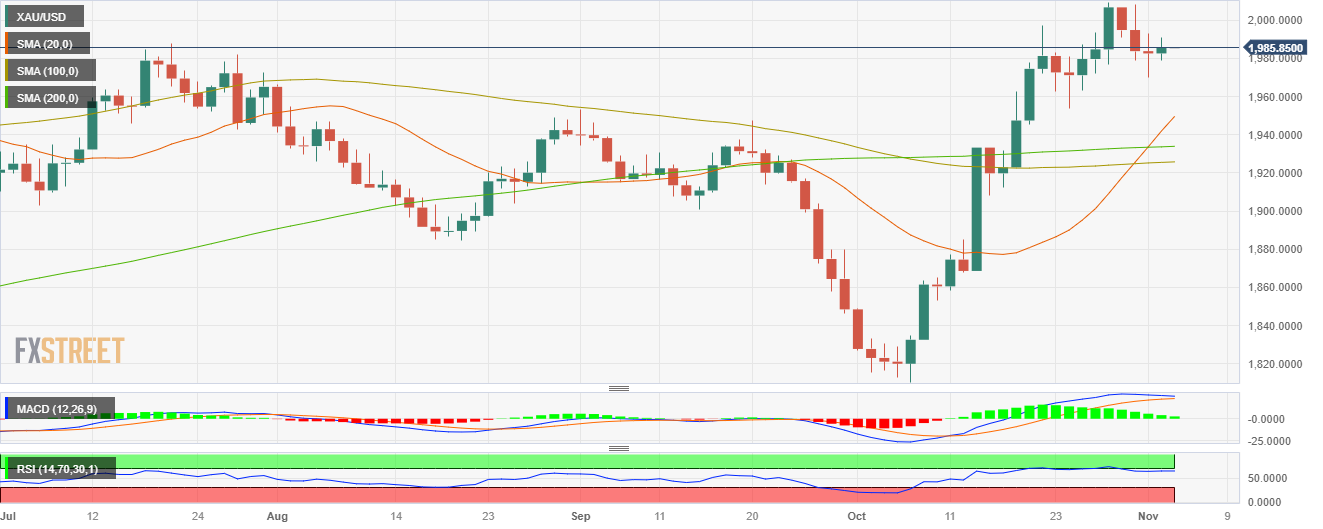
The technical analysis of the daily chart points to a neutral to bullish outlook for XAU/USD, indicating a decline in bullish strength as the metal seems to be correcting overbought conditions after hitting $2,000 last week.
With a flat slope above its midline, the Relative Strength Index (RSI) suggests a period of stability in positive territory, while the Moving Average Convergence (MACD) displays weaker green bars. Furthermore, the pair is above the 20,100,200-day Simple Moving Average (SMAs), suggesting that the bears are struggling to challenge the overall bullish trend.
Support levels: $1,970, $1,950, $1,930.
Resistance levels: $2,000,$2,015, $2,030.
XAU/USD Daily chart

© 2000-2026. All rights reserved.
This site is managed by Teletrade D.J. LLC 2351 LLC 2022 (Euro House, Richmond Hill Road, Kingstown, VC0100, St. Vincent and the Grenadines).
The information on this website is for informational purposes only and does not constitute any investment advice.
The company does not serve or provide services to customers who are residents of the US, Canada, Iran, The Democratic People's Republic of Korea, Yemen and FATF blacklisted countries.
Making transactions on financial markets with marginal financial instruments opens up wide possibilities and allows investors who are willing to take risks to earn high profits, carrying a potentially high risk of losses at the same time. Therefore you should responsibly approach the issue of choosing the appropriate investment strategy, taking the available resources into account, before starting trading.
Use of the information: full or partial use of materials from this website must always be referenced to TeleTrade as the source of information. Use of the materials on the Internet must be accompanied by a hyperlink to teletrade.org. Automatic import of materials and information from this website is prohibited.
Please contact our PR department if you have any questions or need assistance at pr@teletrade.global.


