- Analytics
- News and Tools
- Market News
- USD/SGD declines below the 20-day SMA as the USD weakens
USD/SGD declines below the 20-day SMA as the USD weakens
- USD/SGD trades below 1.3700 with 0.20 daily losses.
- Inflation in Singapore came in slightly lower than expected.
- The US Dollar trades soft ahead of high-tier economic figures to be released this week.
The USD/SGD declined in Monday's session, mainly driven by the Greenback trading weak against its rivals amid dovish bets on the Federal Reserve (Fed) and lower US Treasury yields. The SGD managed to hold its foot despite lower-than-expected inflation data released during the Asian session, and the focus shifts to key economic activity figures from the US to be released during the week. The economic calendar had nothing relevant to offer on Monday.
The Consumer Price Index (CPI) from Singapore from September came in at 4.1% YoY, lower than the 4.2% YoY expected but accelerated from its last figure of 4.2% YoY.
On the US side, it trades softs as market speculations lean towards a less aggressive approach by the Federal Reserve (Fed) following Chair Powell's speech last week. In his address, Powell emphasised the need to consider the elevated bond yields and stressed the importance of cautious actions in the next decisions. In that sense, the CME FedWatch tool indicates minimal probabilities, currently at approximately 30%, for a 25 basis points hike in the December meeting, which has led to a decline in interest in the US dollar.
On the data front, the US will release the S&P Manufacturing PMI from October on Tuesday, followed by the Q3 Gross Domestic Product (GDP) on Thursday and the Core Personal Consumption Expenditures from September on Friday.
USD/SGD Levels to watch
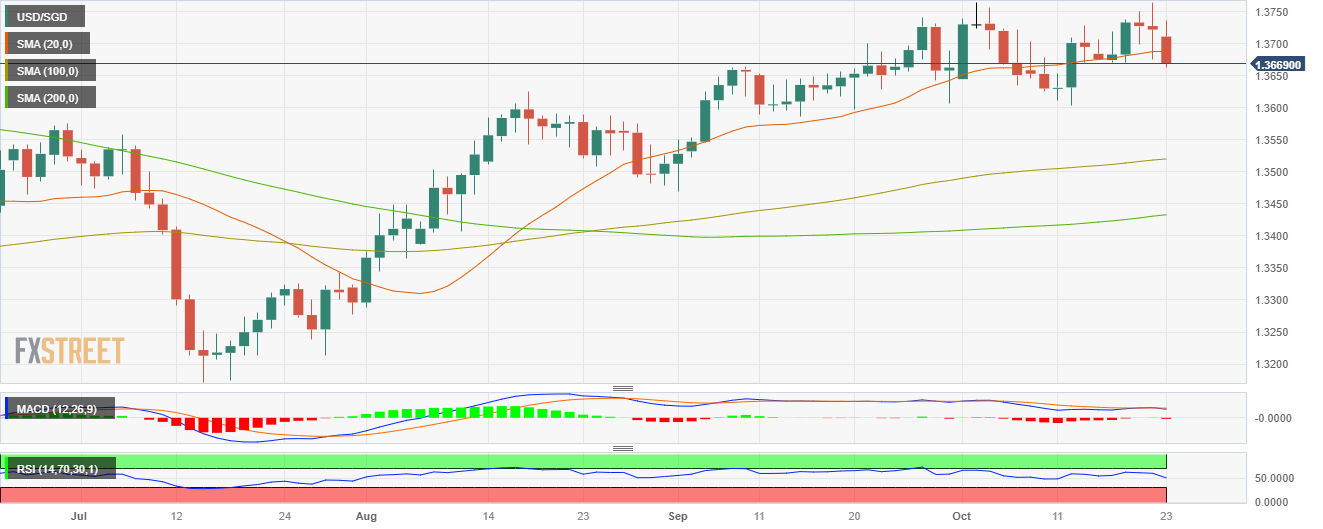
Analysing the daily chart, USD/SGD exhibits signs of bullish exhaustion, contributing to a neutral to bearish technical perspective. The Relative Strength Index (RSI) displays a negative slope in the bullish territory, hinting at a potential shift in momentum, while the Moving Average Convergence (MACD) shows flat green bars. However, the pair is above the 100 and 200-day Simple Moving Average (SMA), highlighting the continued dominance of bulls on the broader scale.
Support levels:1.3660, 1.3650, 1.3630.
Resistance levels: 1.3690 (20-day SMA), 1.3740, 1.3770, 1.3800.
USD/SGD Daily chart
© 2000-2026. All rights reserved.
This site is managed by Teletrade D.J. LLC 2351 LLC 2022 (Euro House, Richmond Hill Road, Kingstown, VC0100, St. Vincent and the Grenadines).
The information on this website is for informational purposes only and does not constitute any investment advice.
The company does not serve or provide services to customers who are residents of the US, Canada, Iran, The Democratic People's Republic of Korea, Yemen and FATF blacklisted countries.
Making transactions on financial markets with marginal financial instruments opens up wide possibilities and allows investors who are willing to take risks to earn high profits, carrying a potentially high risk of losses at the same time. Therefore you should responsibly approach the issue of choosing the appropriate investment strategy, taking the available resources into account, before starting trading.
Use of the information: full or partial use of materials from this website must always be referenced to TeleTrade as the source of information. Use of the materials on the Internet must be accompanied by a hyperlink to teletrade.org. Automatic import of materials and information from this website is prohibited.
Please contact our PR department if you have any questions or need assistance at pr@teletrade.global.


