- Analytics
- News and Tools
- Market News
- USD/BRL declines near the 200-day SMA, eyes on Argentinian elections
USD/BRL declines near the 200-day SMA, eyes on Argentinian elections
- USD/BRL saw more than 0.30% losses and fell to monthly lows.
- Argentinian left-wing Sergio Massa was unexpectedly the highest-voted candidate in the first-round elections from Argentina on Sunday.
- Brazil will release Mid-month inflation data from October on Thursday.
- Investors await high-tier economic data from the US to continue modelling their expectations on the Fed.
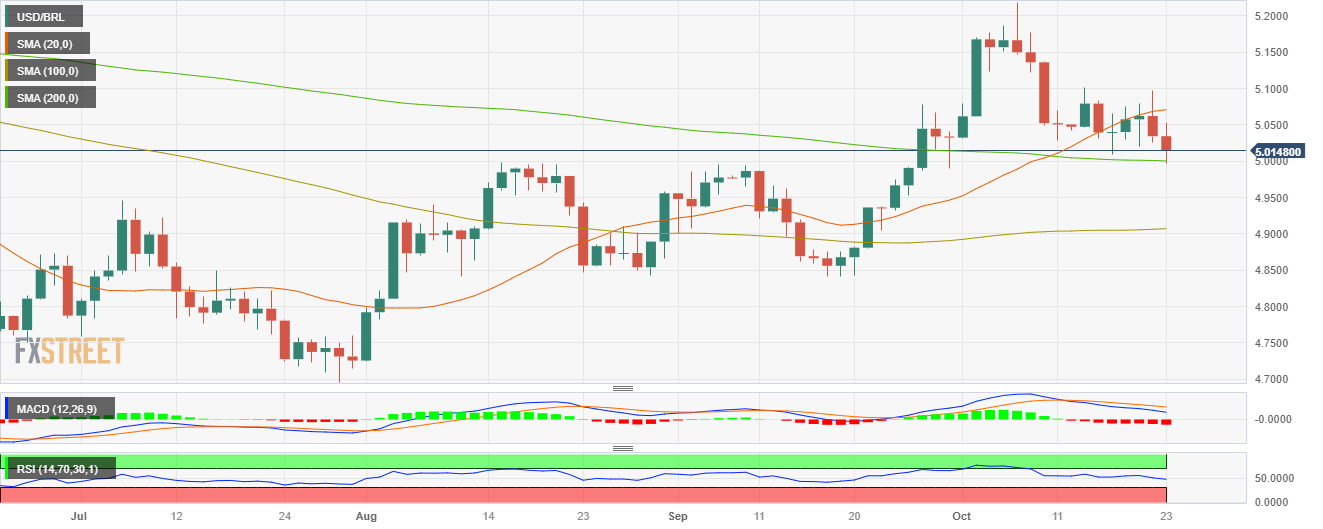
On Monday, the USD/BRL fell to its lowest level since early September, towards the 5.010 area, down by more than 0.30%. The broad-based USD weakness in FX markets can explain this trajectory and focus is now set on high-tier economic activity figures from the US released this week.
On the BRL side, mid-month inflation data from October will be closely watched on Thursday. In addition, investors should monitor the Argentinian political situation as it is one of its main trading partners. On Sunday, Sergio Massa, representing the left-wing Union Por La Patria movement, unexpectedly was the front-runner in Argentina’s first-round elections over the favourite Javier Milei from la Libertad Avanza. It is worth noticing that both candidates are on opposite poles economically, and the winner will shape the area's economic landscape, which could affect the BRL price dynamics.
On the USD side, the US will release the S&P Manufacturing PMI from October on Tuesday, followed by the Q3 Gross Domestic Product (GDP) and the Core Personal Consumption Expenditures from September, the Fed’s preferred inflation gauge. All data points will guide investors in modelling their expectations for the next meetings, and in the meantime, markets are confident that the Fed won’t hike again in 2023 and those dovish bets, makes the USD lose interest.
USD/BRL Levels to watch
The technical analysis of the daily chart suggests a neutral to bearish stance for USD/BRL as the bears work on staging a recovery and gaining further ground. The Relative Strength Index (RSI) points south below its middle point, while the Moving Average Convergence (MACD) histogram presents rising red bars. On the other hand, the pair is below the 20-day Simple Moving Average (SMA) but above the 100 and 200-day SMAs, highlighting that on the broader picture, the outlook still favours the bulls.
Support levels: 5.0000 (200-day SMA), 4.9700, 4.9500.
Resistance levels: 5.0535, 5.0700 (20-day SMA), 5.0940.
USD/BRL Daily Chart

© 2000-2026. All rights reserved.
This site is managed by Teletrade D.J. LLC 2351 LLC 2022 (Euro House, Richmond Hill Road, Kingstown, VC0100, St. Vincent and the Grenadines).
The information on this website is for informational purposes only and does not constitute any investment advice.
The company does not serve or provide services to customers who are residents of the US, Canada, Iran, The Democratic People's Republic of Korea, Yemen and FATF blacklisted countries.
Making transactions on financial markets with marginal financial instruments opens up wide possibilities and allows investors who are willing to take risks to earn high profits, carrying a potentially high risk of losses at the same time. Therefore you should responsibly approach the issue of choosing the appropriate investment strategy, taking the available resources into account, before starting trading.
Use of the information: full or partial use of materials from this website must always be referenced to TeleTrade as the source of information. Use of the materials on the Internet must be accompanied by a hyperlink to teletrade.org. Automatic import of materials and information from this website is prohibited.
Please contact our PR department if you have any questions or need assistance at pr@teletrade.global.


