- Analytics
- News and Tools
- Market News
- USD/ZAR reverses its course and drops below the 20-day SMA
USD/ZAR reverses its course and drops below the 20-day SMA
- USD/ZAR dropped below the 20-day SMA after peaking at a high of 19.15.
- South African CPI from September came in higher than expected as well as Retail Sales.
- Safe haven flows dominate markets, with focus shifting to geopolitics.
At the end of the week, the USD/ZAR trades with mild losses at 19.000, with the ZAR holding its foot driven by hot inflation figures reported on Thursday. On the USD side, it trades soft against its rivals, but a sour market good with investors turning their focus to tensions in the Middle East may reignite the green currency’s momentum.
From September, the Consumer Price Index (CPI) from South Africa came in at 5.4% YoY, higher than the 5.3% expected and the previous 4.8%. In line with that, the ZAR gained momentum as markets is now expecting the South African Reserve Bank (SARB) to maintain its rates higher for a prolonged time as they is targeting inflation to drop in the range between 3% and 6%. On Tuesday, in the October Monetary Policy review, the bank was seen stating that higher oil prices and dry weather conditions were all negatively impacting the inflation outlook. Still, the bank did not hint at additional hikes but confirmed that it will keep rates unchanged at this level for a prolonged period.
On the USD side, it will likely close the week with nearly 0.40% losses, and the green currency faced selling pressure on Thursday after Jerome Powell’s words where he hinted that the higher bond yields will be considered in the next monetary policy decisions. That being said, the US economy is holding strong, and Powell left the door open to another hike in 2023, which could limit the downside for the USD. In addition, growing escalations in the Middle East may fuel safe-haven flows, which would benefit the Greenback, as investors may seek refuge in it.
USD/ZAR Levels to watch
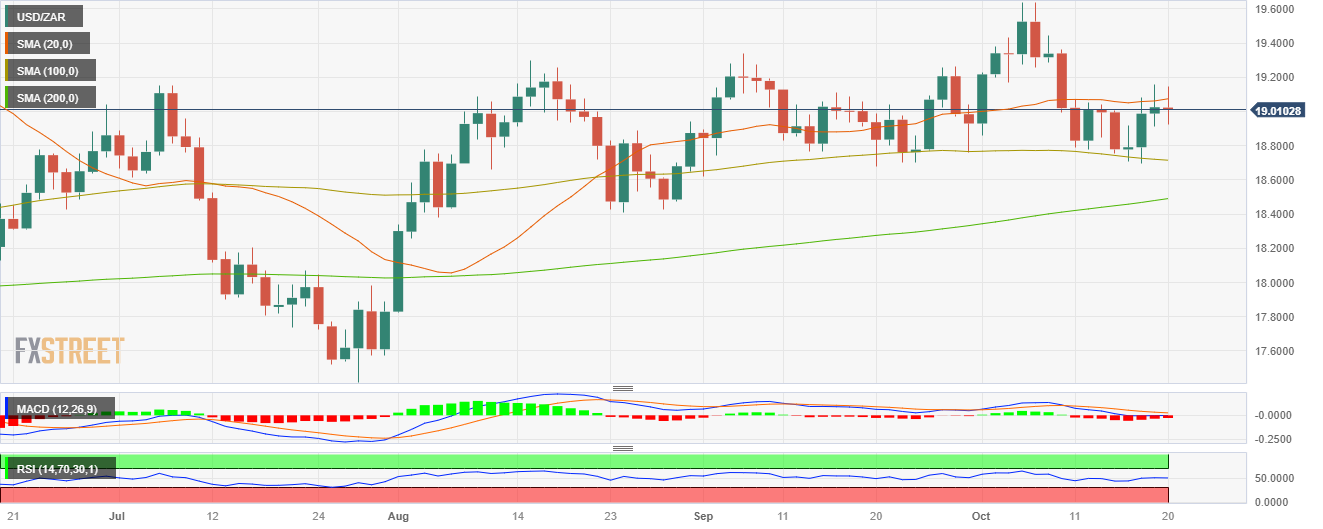
Analysing the daily chart, a neutral to bearish technical outlook is evident for USD/ZAR, suggesting that the bears are gaining momentum but still do not have an upperhand over the bulls for the short term. The Relative Strength Index (RSI) has turned flat above its midline, while the Moving Average Convergence (MACD) prints flat red bars. Moreover, the pair is below the 20-day Simple Moving Average (SMA) but above the 100 and 200-day SMAs, indicating a favourable position for the bulls in the bigger picture.
Support levels: 18.905, 18.800, 18.701 (100-day SMA).
Resistance levels: 19.050 (20-day SMA), 19.157, 19.250.
USD/ZAR Daily Chart

© 2000-2026. All rights reserved.
This site is managed by Teletrade D.J. LLC 2351 LLC 2022 (Euro House, Richmond Hill Road, Kingstown, VC0100, St. Vincent and the Grenadines).
The information on this website is for informational purposes only and does not constitute any investment advice.
The company does not serve or provide services to customers who are residents of the US, Canada, Iran, The Democratic People's Republic of Korea, Yemen and FATF blacklisted countries.
Making transactions on financial markets with marginal financial instruments opens up wide possibilities and allows investors who are willing to take risks to earn high profits, carrying a potentially high risk of losses at the same time. Therefore you should responsibly approach the issue of choosing the appropriate investment strategy, taking the available resources into account, before starting trading.
Use of the information: full or partial use of materials from this website must always be referenced to TeleTrade as the source of information. Use of the materials on the Internet must be accompanied by a hyperlink to teletrade.org. Automatic import of materials and information from this website is prohibited.
Please contact our PR department if you have any questions or need assistance at pr@teletrade.global.


