- Analytics
- News and Tools
- Market News
- GBP/USD springs higher, looking for 1.23
GBP/USD springs higher, looking for 1.23
- GBP/USD catches a bid on improving market sentiment, setting a new two-week high.
- UK GDP, manufacturing & production figures due later in the week, BoE Gov Bailey to speak on Friday.
- US inflation data remains a key focus for broader markets, PPI and CPI in the barrel for Wednesday, Thursday.
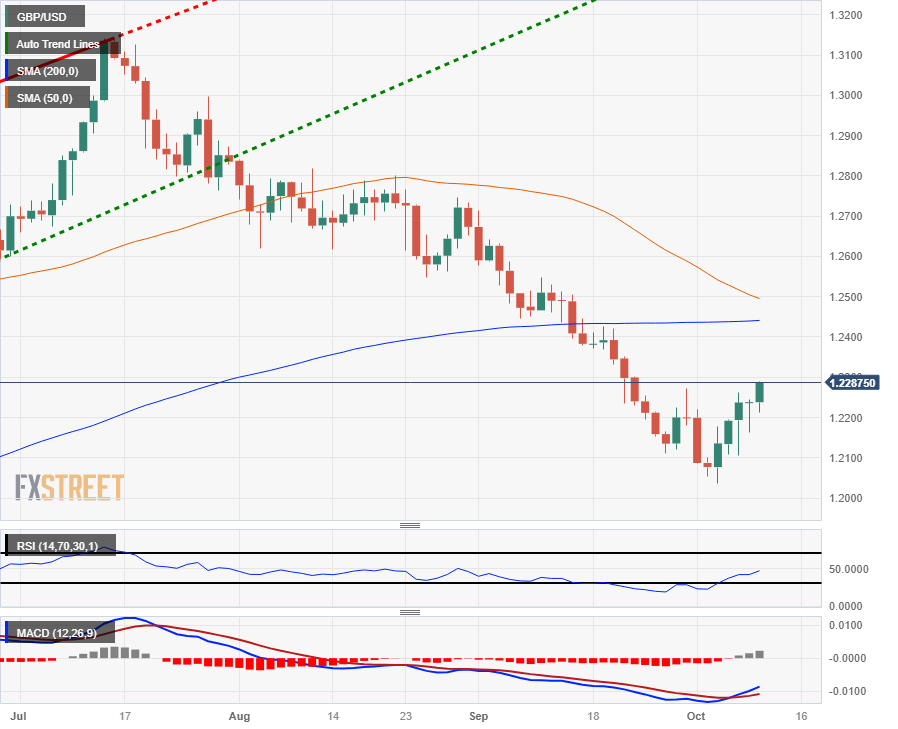
The GBP/USD is trading higher on Tuesday as market sentiment cautiously recovers following the weekend's Israel-Hamas conflict escalation, and the Pound Sterling (GBP) is catching a bid into fresh two-week highs just shy of 1.2300.
It's a bumper week for US inflation data, with Producer Price Index (PPI) and Consumer Price Index (CPI) figures due tomorrow and Thursday respectively, but the Pound Sterling is also represented on the calendar, with Gross Domestic Product (GDP) and Industrial & Manufacturing Production numbers in the barrel for Thursday.
Federal Reserve (Fed) officials have been hitting the newswires for Tuesday, talking down the potential for further rate hikes, keeping the US Dollar (USD) on the low side and giving risk assets a chance to recover some ground.
Read More:
Fed's Bostic: We don't need to increase rates any more
NY Fed's Perli: No sign yet Fed needs to change balance sheet plans
UK GDP figures on Thursday are expected to show a mild recovery, with the monthly figure for August forecast to print at 0.2%, against the previous -0.5%.
Industrial & Manufacturing Production for the same period is expected to improve but still show minor declines, with the industrial component expected at -0.2% versus the previous -0.7%, and the manufacturing component is seen printing at -0.4% versus the previous -0.8%.
NY Fed: Year-ahead expected inflation edges higher to 3.7% from 3.6% in August
GBP/USD Technical Outlook
The Pound Sterling is set to close in the green for the fifth straight day against the US Dollar, having climbed over 2% from the last low at 1.2037, and the GBP/USD pair is set to take another run at climbing back over the 200-day Simple Moving Average (SMA) near 1.2441, though the 50-day SMA is moving bearish rapidly, declining into 1.2495 and set for a bearish cross of the longer moving average.
GBP/USD Daily Chart

GBP/USD Technical Levels
© 2000-2026. All rights reserved.
This site is managed by Teletrade D.J. LLC 2351 LLC 2022 (Euro House, Richmond Hill Road, Kingstown, VC0100, St. Vincent and the Grenadines).
The information on this website is for informational purposes only and does not constitute any investment advice.
The company does not serve or provide services to customers who are residents of the US, Canada, Iran, The Democratic People's Republic of Korea, Yemen and FATF blacklisted countries.
Making transactions on financial markets with marginal financial instruments opens up wide possibilities and allows investors who are willing to take risks to earn high profits, carrying a potentially high risk of losses at the same time. Therefore you should responsibly approach the issue of choosing the appropriate investment strategy, taking the available resources into account, before starting trading.
Use of the information: full or partial use of materials from this website must always be referenced to TeleTrade as the source of information. Use of the materials on the Internet must be accompanied by a hyperlink to teletrade.org. Automatic import of materials and information from this website is prohibited.
Please contact our PR department if you have any questions or need assistance at pr@teletrade.global.


