- Analytics
- News and Tools
- Market News
- EUR/USD treading water near 1.0660, hanging near the top of the range
EUR/USD treading water near 1.0660, hanging near the top of the range
- EUR/USD spends Friday trading into familiar territory.
- US PMIs kept the USD capped with a mixed print.
- USD on track to close out with weekly gains, but capped for the end of the week.
The EUR/USD is trading into neutral ground heading into the end of the trading week, testing well-trodded ground near the 1.0660 handle.
US Purchasing Manager Index (PMI) figures came in off-kilter, triggering a soft walkback for the Greenback (USD) during the Friday trading session, but keeping losses limited to intraday boundaries.
European PMI figures earlier on Friday saw the Euro (EUR) ease back after an unexpected drop, with the manufacturing component printing at 43.4 versus the forecast 44.0.
The US Manufacturing PMI printed above expectations at 48.9 for September, compared to 47.9 for August, but the Services PMI component fell back to 50.2, reversing the market forecast increase to 50.6.
Read more:
Eurozone Preliminary Manufacturing PMI unexpectedly falls to 43.4 in September vs. 44.0 expected
US S&P Global Manufacturing PMI improves to 48.9, Services PMI declines to 50.2 in September
EUR/USD corkscrews on PMIs that disappoint on both sides of the pond
The economic calendar looking forward is notably thin for the first half of next week, though traders will want to keep at least one eye on US Consumer Confidence on Tuesday, as well as Wednesday's Durable Goods Orders.
Market analysts see Durable Goods Orders for August slipping back only 0.4% after the previous reading of -5.2%.
EUR/USD technical outlook
The Euro has been cycling the 1.0660 level but has so far been unable to meaningfully mount the technical level, and is pacing familiar territory to close out the trading week.
The EUR/USD fell to a Friday low of 1.0615 but recovered to the top side near Friday's peak just north of 1.0670.
Hourly candles see the EUR/USD trading just south of the 200-hour Simple Moving Average (SMA) near 1.0685.
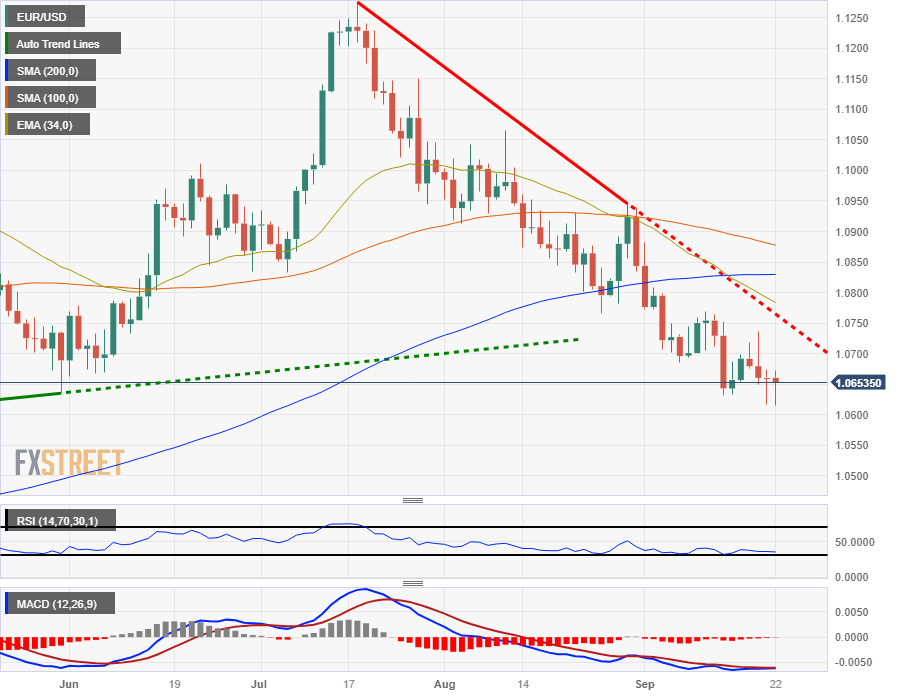
On the daily candlesticks, the Euro is decidedly bearish, continuing to decline through the 200-day SMA and down almost 5.5% from July's peak near 1.1275.
The 34-day Exponential Moving Average (EMA) is set to confirm a bearish cross of the 200-day SMA, and investors might be looking out for a relief rally to a major technical level before resuming another leg down.
EUR/USD daily chart

EUR/USD technical levels
© 2000-2026. All rights reserved.
This site is managed by Teletrade D.J. LLC 2351 LLC 2022 (Euro House, Richmond Hill Road, Kingstown, VC0100, St. Vincent and the Grenadines).
The information on this website is for informational purposes only and does not constitute any investment advice.
The company does not serve or provide services to customers who are residents of the US, Canada, Iran, The Democratic People's Republic of Korea, Yemen and FATF blacklisted countries.
Making transactions on financial markets with marginal financial instruments opens up wide possibilities and allows investors who are willing to take risks to earn high profits, carrying a potentially high risk of losses at the same time. Therefore you should responsibly approach the issue of choosing the appropriate investment strategy, taking the available resources into account, before starting trading.
Use of the information: full or partial use of materials from this website must always be referenced to TeleTrade as the source of information. Use of the materials on the Internet must be accompanied by a hyperlink to teletrade.org. Automatic import of materials and information from this website is prohibited.
Please contact our PR department if you have any questions or need assistance at pr@teletrade.global.


