- Analytics
- News and Tools
- Market News
- WTI crude oil settling back after jumping over $90.50
WTI crude oil settling back after jumping over $90.50
WTI spiked in Thursday trading, briefly retaking $90.50/bbl before settling back towards $89.50.
Crude oil gained nearly $2/bbl for the day as supply constraints keep barrel prices pinned.
Intraday prices set to continue cycling the $90 figure in the interim as analysts expect $100 in the future.
West Texas Intermediary (WTI )crude oil barrels caught another run up the charts on Thursday, spiking from the day's low to retake a near-term high water mark. The move ran out of gas heading into the back of the trading day, and prices are currently looking for a foothold just beneath $90/bbl.
OPEC+ producers continue their intentional production drawdown, and market analysts expect crude prices to bleed upwards into the $100/bbl range in the coming months.
Supply constraints cut barrel production deep
Saudi Arabia and Russia's 1.3 million barrel per day combined supply cuts have been extended through the end of the year, exacerbating what analysts foresee as a 2 million bpd shortfall in global oil supplies.
Global oil reserves are expected to dwindle in the coming months as governments and independent producers bleed barrels, either to help stabilize domestic fuel costs or to take advantage of rising barrel prices.
With oil barrel prices getting squeezed at the origin point, oil refiners will be scrambling to capture as much of the constrained market as possible, adding further upside pressure. Refinery profit margins are at their highest point in years, and facilities will be looking to increase their supply as much as possible as barrel prices move higher.
WTI technical outlook
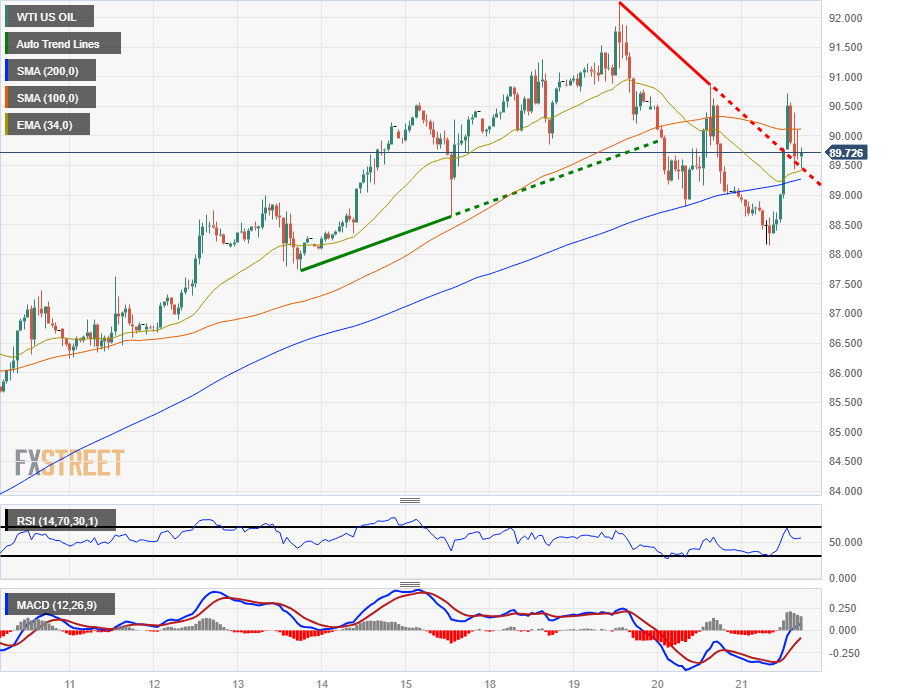
WTI crude barrels caught a bounce from the near-term low of $88.25, retaking the 200-hour Simple Moving Average (SMA) near $89.30.
Intraday prices still remain below last week's swing high above $92.00, though a bullish break of a descending trendline from that level could lend support for upside price movements.
US crude barrel prices have climbed nearly 35% from the year's lows near $65.00, and daily candlesticks see recent price expansion climbing away from the 34-day Exponential Moving Average (EMA) currently testing into $85.00.
WTI hourly chart

WTI technical levels
© 2000-2026. All rights reserved.
This site is managed by Teletrade D.J. LLC 2351 LLC 2022 (Euro House, Richmond Hill Road, Kingstown, VC0100, St. Vincent and the Grenadines).
The information on this website is for informational purposes only and does not constitute any investment advice.
The company does not serve or provide services to customers who are residents of the US, Canada, Iran, The Democratic People's Republic of Korea, Yemen and FATF blacklisted countries.
Making transactions on financial markets with marginal financial instruments opens up wide possibilities and allows investors who are willing to take risks to earn high profits, carrying a potentially high risk of losses at the same time. Therefore you should responsibly approach the issue of choosing the appropriate investment strategy, taking the available resources into account, before starting trading.
Use of the information: full or partial use of materials from this website must always be referenced to TeleTrade as the source of information. Use of the materials on the Internet must be accompanied by a hyperlink to teletrade.org. Automatic import of materials and information from this website is prohibited.
Please contact our PR department if you have any questions or need assistance at pr@teletrade.global.


