- Analytics
- News and Tools
- Market News
- S&P 500 ends lower as Fed rate hikes speculations rise after strong ISM data
S&P 500 ends lower as Fed rate hikes speculations rise after strong ISM data
- S&P 500 closes down 0.70%, Nasdaq 100 drops over 1%, and Dow Jones Industrial Average falls 0.57%.
- ISM Non-Manufacturing data for August fuels speculation of an additional rate hike by the Fed.
- CME FedWatch Tool shows a 50% chance of a 25 bps rate hike by the Fed in November.
Wall Street finished Wednesday’s session with losses of between 0.57% and 0.70% after data put into the table additional rate hikes by the US Federal Reserve (Fed), as business activity accelerated in the services sector. Consequently, US Treasury bond yields rose, and the Greenback hit a 10-month high before finishing the session almost unchanged.
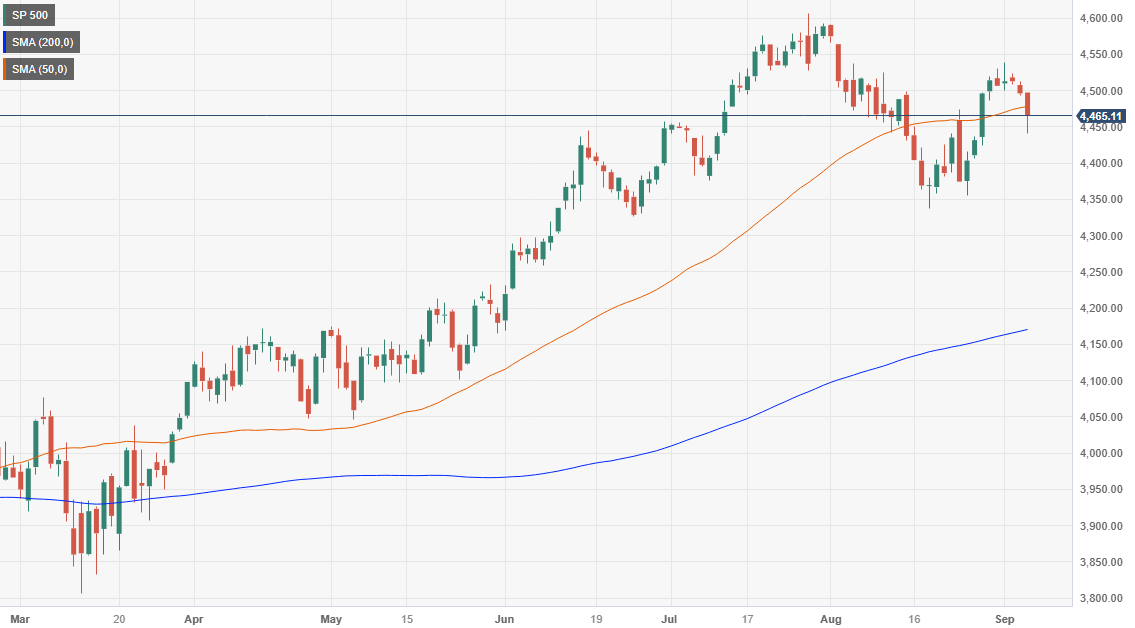
The S&P 500 ended the session with losses of 0.70%, while the heavy-tech Nasdaq 100 dropped more than 1%, and the Dow Jones Industrial Average slumped 0.57%.
Wall Street indices close in the red; Technology, Consumer Discretionary, and Health sectors lead the decline
Sector-wise, the biggest loser was Technology, followed by Consumer Discretionary and Health, each down by 1.37%, 0.97% and 0.61%. On the flip side, Utilities and Energ post modest gains of 0.20% and 0.14%.
The Institute for Supply Management (ISM) revealed that Non-Manufacturing activity improved in August, sparking speculations that an additional rate hike by the Fed is on the table. According to money market futures, there’s a 50% chance the US central could hike 25 bps at the November meeting, as shown by the CME FedWatch Tool.
In the meantime, the Federal Reserve released its Beige Book, which showed modest economic growth and inflation slowed in most parts of the country.
Boston Fed’s President Susan Collins said the US central bank needs to be patient when deciding the path of monetary policy while emphasizing the Fed’s commitment to bring inflation toward its 2% target.
WTI rose almost by 1% in the commodity space underpinned by Saudi Arabia and Russia’s 1.3 million barrel supply cut as traders eyed the release of US crude oil inventories.
S&P 500 Price Action – Daily Chart

S&P 500 Technical Levels
© 2000-2026. All rights reserved.
This site is managed by Teletrade D.J. LLC 2351 LLC 2022 (Euro House, Richmond Hill Road, Kingstown, VC0100, St. Vincent and the Grenadines).
The information on this website is for informational purposes only and does not constitute any investment advice.
The company does not serve or provide services to customers who are residents of the US, Canada, Iran, The Democratic People's Republic of Korea, Yemen and FATF blacklisted countries.
Making transactions on financial markets with marginal financial instruments opens up wide possibilities and allows investors who are willing to take risks to earn high profits, carrying a potentially high risk of losses at the same time. Therefore you should responsibly approach the issue of choosing the appropriate investment strategy, taking the available resources into account, before starting trading.
Use of the information: full or partial use of materials from this website must always be referenced to TeleTrade as the source of information. Use of the materials on the Internet must be accompanied by a hyperlink to teletrade.org. Automatic import of materials and information from this website is prohibited.
Please contact our PR department if you have any questions or need assistance at pr@teletrade.global.


