- Analytics
- News and Tools
- Market News
- USD/MXN tests 17.00 figure amid expectations of Fed’s hike past July FOMC’s meeting
USD/MXN tests 17.00 figure amid expectations of Fed’s hike past July FOMC’s meeting
- Positive sentiment supports the Mexican Peso (MXN), but Fed tightening concerns arise due to last week’s US unemployment data.
- Expectations for a post-July Fed rate hike rise to 28%, a significant leap from last month’s 15.9% odds, as the CME FedWatch Tool reported.
- USD/MXN traders eye next week’s Mexican inflation data, with both readings expected to decelerate.
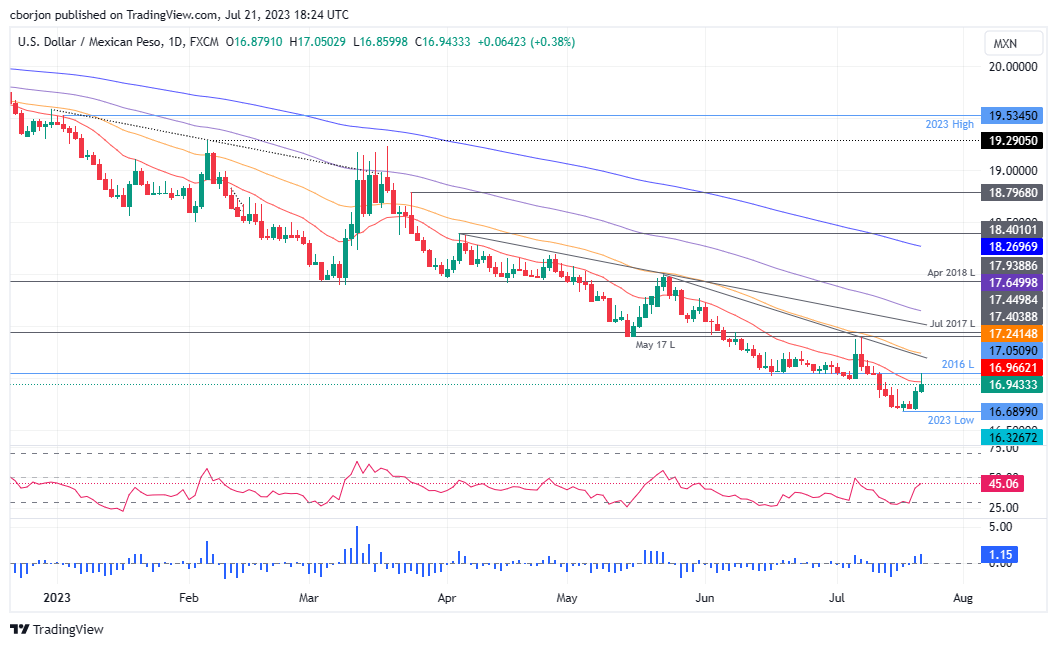
USD/MXN holds to its earlier gains after reaching the 17.00 figure on Friday but trimmed some as the USD/MXN pair edged towards the 20-day Exponential Moving Average (EMA) at 16.9666. At the time of writing, the USD/MXN is trading at 16.9494, climbing 0.47%, ahead of the weekend.
USD/MXN sees slight trim after peaking at 17.00, buoyed by solid US jobs data and mounting anticipation of Federal Reserve tightening
Sentiment remains upbeat, which usually favors the Mexican Peso (MXN). Nevertheless, last week’s US unemployment claims for the week ending July 15 spurred woes the Federal Reserve (Fed) would continue to tighten monetary conditions past the July meeting. Other data revealed during the day was mixed, with US retail sales missing estimates, but continued to show consumers resilience, while housing market data witnessed a dip after registering positive figures in May.
Meanwhile, expectations the Fed would raise rates past the July meeting surged to 28%, from last month’s 15.9% odds, as revealed by the CME FedWatch Tool.
Consequently, the greenback rose, registering more than 1% weekly gains. As of writing, the US Dollar Index (DXY), a measure that tracks the performance of the US Dollar against six peers, sits at 101.052, which advances 0.23%, on Friday.
That helped to offset some of the USD/MXN 4.27% losses during the last couple of weeks, with the pair briefly testing the 17.00 psychological barrier.
Retail sales disappointed USD/MXN traders on the Mexican front, which punished the peso as the pair climbed 1% on Thursday. On its latest two meetings, the Bank of Mexico (Banxico) kept rates unchanged at 11.25% and is expected to cut rates towards Q4 2023.
The following week’s highlight on the Mexican docket would be the inflation data report, with most traders expecting the Consumer Price Index (CP) at 4.77% in the first 15 days of the month, according to a Reuters poll. Core CPI is expected to slide to 6.73%. Although both figures remain above Banxico’s 3% plus or minus one percentage point target, the disinflationary process continues in the Mexican economy.
USD/MXN Price Analysis: Technical outlook

From a technical standpoint, the USD/MXN probed the 17.00 figure after reaching 7-year lows at 16.6899 but couldn’t break resistance, despite printing a high of 17.0502. Of note, the Relative Strength Index (RSI) indicator is gathering pace toward the 50-midline, suggesting that buyers are increasing their positions, while the three-day Rate of Change (RoC) printed its biggest daily gain since May 23, a major turning point. That could suggest the USD/MXN could be bottoming and preparing for an upward correction. Key resistance levels lie at the 20-day EMA at 16.9667, the 17.00 figure, and the 50-day EMa at 17.2416 in the near term. Contrarily, the first support level would be the YTD low of 16.6899 before testing 16.50.
© 2000-2026. All rights reserved.
This site is managed by Teletrade D.J. LLC 2351 LLC 2022 (Euro House, Richmond Hill Road, Kingstown, VC0100, St. Vincent and the Grenadines).
The information on this website is for informational purposes only and does not constitute any investment advice.
The company does not serve or provide services to customers who are residents of the US, Canada, Iran, The Democratic People's Republic of Korea, Yemen and FATF blacklisted countries.
Making transactions on financial markets with marginal financial instruments opens up wide possibilities and allows investors who are willing to take risks to earn high profits, carrying a potentially high risk of losses at the same time. Therefore you should responsibly approach the issue of choosing the appropriate investment strategy, taking the available resources into account, before starting trading.
Use of the information: full or partial use of materials from this website must always be referenced to TeleTrade as the source of information. Use of the materials on the Internet must be accompanied by a hyperlink to teletrade.org. Automatic import of materials and information from this website is prohibited.
Please contact our PR department if you have any questions or need assistance at pr@teletrade.global.


