- Analytics
- News and Tools
- Market News
- Gold Price Forecast: XAU/USD faces delicate barricades around $1,960, upside remains favored, US PPI eyed
Gold Price Forecast: XAU/USD faces delicate barricades around $1,960, upside remains favored, US PPI eyed
- Gold price is expected to cross the immediate resistance of $1,960.00 as US inflation has decelerated sharply.
- The US Dollar Index has turned sideways around 100.50 after a five-day losing streak.
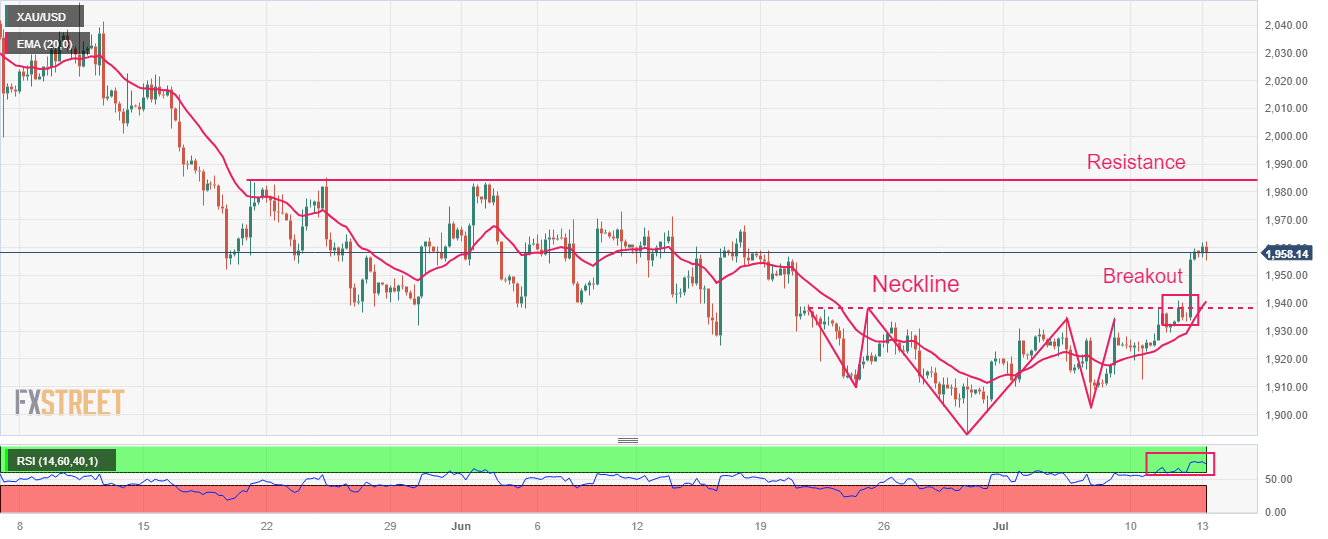
- Gold price has delivered a breakout of the Inverted Head and Shoulder chart pattern.
Gold price (XAU/USD) has faced fragile barricades while attempting to surpass the immediate resistance of $1,960.00 in the late Asian session. The precious metal has is expected to resume its upside journey as inflationary pressures in the United States have softened dramatically and are sufficient to encourage the Federal Reserve (Fed) to go with only one interest rate hike by year-end.
S&P500 futures have posted significant gains overnight. US equities ended on a bullish note on Wednesday, portraying strength in the risk appetite theme. The US-500 stock basket could show some uncertain moves as the second-quarter result season will kick off sooner.
The US Dollar Index (DXY) has turned sideways around 100.50 after a five-day losing streak as the sheer softening of the United States Consumer Price Index (CPI) has trimmed fears of a potential recession. On Thursday, US Producer Price Index (PPI) data will be keenly watched.
About interest rate guidance, economists at Commerzbank cited that in the US, there are increasing signs that inflationary pressure is easing. In June, consumer prices rose by only 0.2% compared with the previous month. The core rate (which excludes energy and food), which is important as a measure of the underlying trend, was also only 0.2%, the smallest increase since February 2021. While the Fed is still likely to raise interest rates again at the end of the month, the data support our view that this should be the last hike.
Gold technical analysis
Gold price has delivered a breakout of the Inverted Head and Shoulder chart pattern formed on a four-hour scale. A breakout of the aforementioned chart pattern has resulted in a bullish reversal. The neckline of the chart pattern was plotted around June 21 high at $1,940.00. The next stop for the Gold bulls is placed around May 19 high at $1,984.25.
The 20-period Exponential Moving Average (EMA) at $1,940.21 will continue to provide a cushion to the Gold bulls.
Meanwhile, the Relative Strength Index (RSI) (14) has confidently shifted into the bullish range of 60.00-80.00, which indicates that the bullish momentum has been triggered.
Gold two-hour chart

© 2000-2026. All rights reserved.
This site is managed by Teletrade D.J. LLC 2351 LLC 2022 (Euro House, Richmond Hill Road, Kingstown, VC0100, St. Vincent and the Grenadines).
The information on this website is for informational purposes only and does not constitute any investment advice.
The company does not serve or provide services to customers who are residents of the US, Canada, Iran, The Democratic People's Republic of Korea, Yemen and FATF blacklisted countries.
Making transactions on financial markets with marginal financial instruments opens up wide possibilities and allows investors who are willing to take risks to earn high profits, carrying a potentially high risk of losses at the same time. Therefore you should responsibly approach the issue of choosing the appropriate investment strategy, taking the available resources into account, before starting trading.
Use of the information: full or partial use of materials from this website must always be referenced to TeleTrade as the source of information. Use of the materials on the Internet must be accompanied by a hyperlink to teletrade.org. Automatic import of materials and information from this website is prohibited.
Please contact our PR department if you have any questions or need assistance at pr@teletrade.global.


