- Analytics
- News and Tools
- Market News
- Gold Price Forecast: XAU/USD refreshes three-week high above $1,940 as US CPI sets to soften further
Gold Price Forecast: XAU/USD refreshes three-week high above $1,940 as US CPI sets to soften further
- Gold price has printed a fresh three-week high above $1,940.00 ahead of US inflation and Fed’s Beige Book.
- Investors have sidelined ahead of the second-quarter corporate earnings and inflation data.
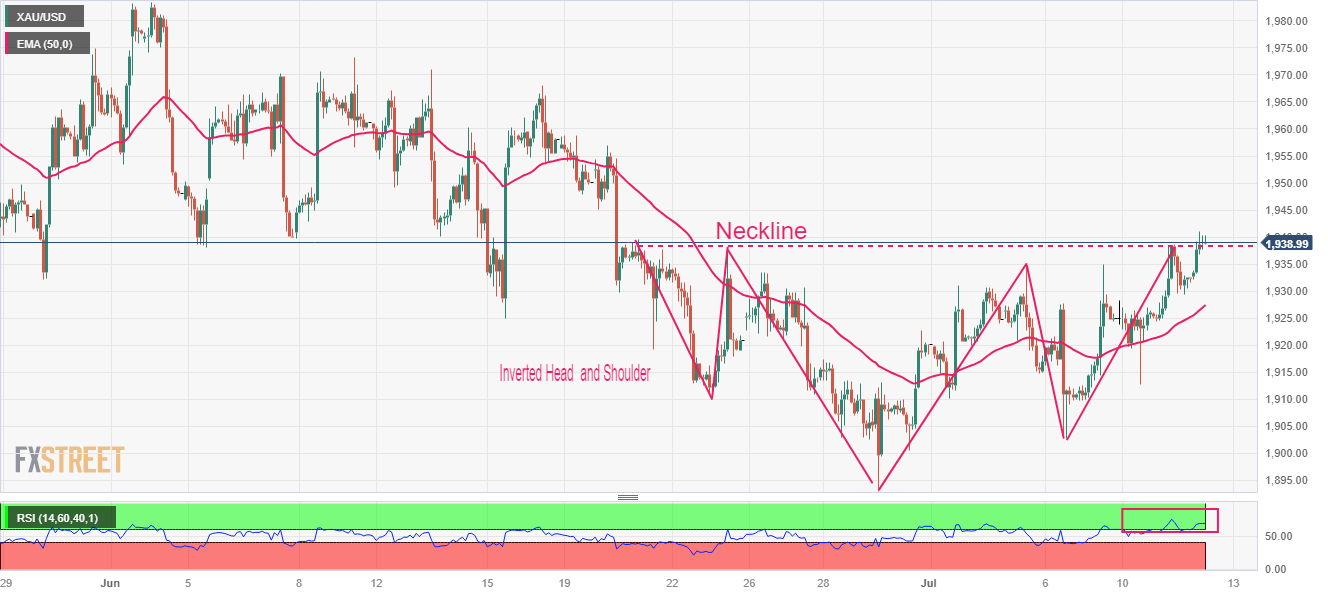
- Gold price is on the verge of delivering a breakout of the Inverted Head and Shoulder pattern.
Gold price (XAU/USD) has printed a fresh three-week high at $1,941.60 in the early European session. The precious metal is gathering strength to deliver a confident break above $1,940.00 as the US Dollar Index (DXY) is under extreme pressure due to expectations of further deceleration in the United States Consumer Price Index (CPI) data.
S&P500 futures have turned choppy after a bullish Tuesday, portraying quiet market sentiment for now in the overall upbeat risk profile. Investors have sidelined ahead of the second-quarter corporate earnings and inflation data. The 10-year US Treasury yields have shown a minor decline to near 3.96%.
The USD Index has found intermediate support near 101.35, however, the downside bias is still solid. Economists at Commerzbank cited it would probably be too early though to write off the Dollar at this stage. The labor market report on Friday was not that bad after all. We assume that the labor market remains too tight for the liking of the Federal Reserve (Fed) and that it will therefore hike its key rate once again at the end of July.
Meanwhile, investors are entirely focusing on the inflation data. As per expectations, monthly and core inflation are expected to maintain a steady pace of 0.3%. Annualized figures for headline and core CPI are likely to soften to 3.1% and 5.0% respectively. Apart from the inflation data, investors will also focus on the Fed’s Beige Book.
Gold technical analysis
Gold price is on the verge of delivering a breakout of the Inverted Head and Shoulder chart pattern formed on a two-hour scale. A breakout of the aforementioned chart pattern will result in a bullish reversal. The neckline of the chart pattern is plotted around June 21 high at $1,940.00.
The 50-period Exponential Moving Average (EMA) at $1,927.65 is providing a cushion to the Gold bulls.
Meanwhile, the Relative Strength Index (RSI) (14) has confidently shifted into the bullish range of 60.00-80.00, which indicates that the bullish momentum has been triggered.
Gold two-hour chart

© 2000-2026. All rights reserved.
This site is managed by Teletrade D.J. LLC 2351 LLC 2022 (Euro House, Richmond Hill Road, Kingstown, VC0100, St. Vincent and the Grenadines).
The information on this website is for informational purposes only and does not constitute any investment advice.
The company does not serve or provide services to customers who are residents of the US, Canada, Iran, The Democratic People's Republic of Korea, Yemen and FATF blacklisted countries.
Making transactions on financial markets with marginal financial instruments opens up wide possibilities and allows investors who are willing to take risks to earn high profits, carrying a potentially high risk of losses at the same time. Therefore you should responsibly approach the issue of choosing the appropriate investment strategy, taking the available resources into account, before starting trading.
Use of the information: full or partial use of materials from this website must always be referenced to TeleTrade as the source of information. Use of the materials on the Internet must be accompanied by a hyperlink to teletrade.org. Automatic import of materials and information from this website is prohibited.
Please contact our PR department if you have any questions or need assistance at pr@teletrade.global.


