- Analytics
- News and Tools
- Market News
- Silver Price Forecast: XAG/USD rises after weak US Manufacturing PMI
Silver Price Forecast: XAG/USD rises after weak US Manufacturing PMI
- XAG/USD stands with nearly 0.50% gains near $22.90 after reaching a daily high of $23.70.
- US Manufacturing PMI fell to 46 in June, a contraction worse than expected.
- Falling US Treasury yields gave room for the precious metal to rise.
Silver prices (XAG/USD) are rising, showing gains of approximately 0.70% and trading near $22.90, following a surge that led to a daily high of $23.70. This upward momentum comes in response to the weak US Manufacturing Purchasing Managers' Index (PMI) for June, which recorded a contractionary figure of 46, falling short of expectations. The decline in US Treasury yields has allowed the precious metal to advance, although it is worth noting that yields are still in positive territory, which can limit the XAG/USD’s upside potential.
US reported weak Manufacturing PMI; yields hold their ground
The most recent release of the Institute for Supply Management's (ISM) Manufacturing Purchasing Managers Index (PMI) for June revealed a reading of 46, falling short of the expected 47.2 and the previous figure of 46.9.
Despite a broad retreat in US yields (which could be seen as the opportunity cost of holding Silver), the Federal Reserve's (Fed) hawkish expectations for July have remained firm. The CME FedWatch Tool indicates that a 25 basis points (bps) hike in the upcoming July 31 meeting is practically priced in, while the likelihood of another 25 bps hike in 2023 has increased to around 40%. Furthermore, market participants eagerly await the release of Non-Farm Payroll (NFP) data on Friday, as it will continue shaping expectations regarding the Fed's future decisions.
That being said, it's worth noticing that higher interest rates tend to weaken precious metal prices, so traders should be aware that a hot NFP reading may trigger further downside for the XAG/USD.
XAG/USD Levels to watch
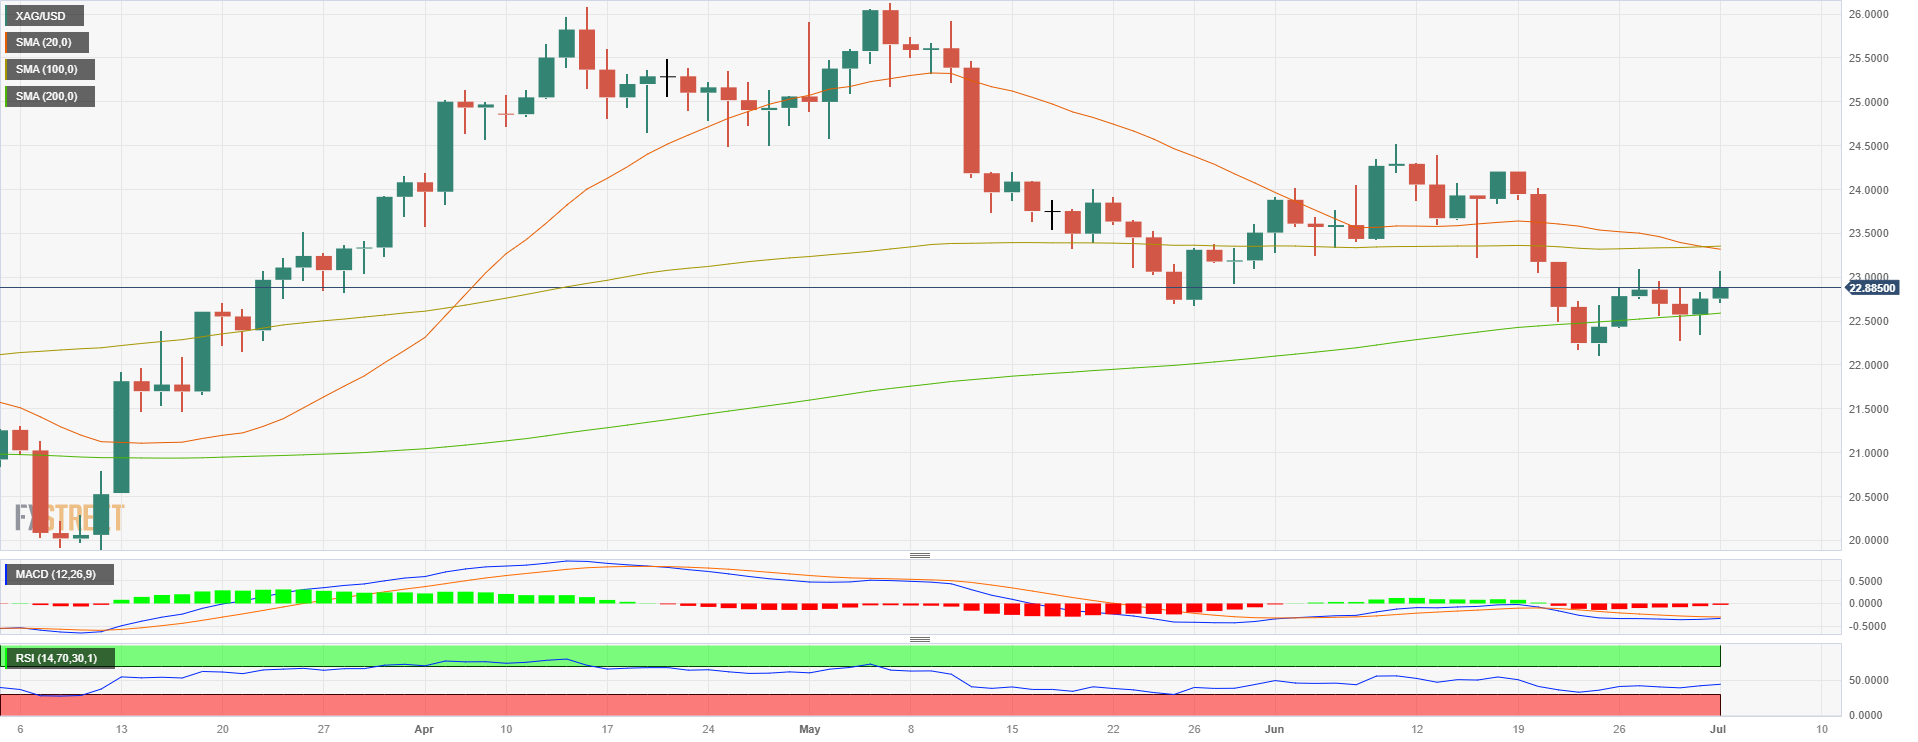
According to the daily chart, the technical outlook for the XAG/USD remains neutral with a bearish bias. The 20 and 100-day Simple Moving Averages (SMAs) are about to perform a bearish cross while indicators remain in negative territory.
If the metal continues to gain ground, resistance levels to consider are seen at the daily high of around $23.05, followed by $23.10 and the mentioned bearish cross at $23.30. Conversely, support levels are seen at the $22.80 level and below at the 200-day SMA at $23.55 and the $23.55 area.
XAG/USD Daily chart

© 2000-2026. All rights reserved.
This site is managed by Teletrade D.J. LLC 2351 LLC 2022 (Euro House, Richmond Hill Road, Kingstown, VC0100, St. Vincent and the Grenadines).
The information on this website is for informational purposes only and does not constitute any investment advice.
The company does not serve or provide services to customers who are residents of the US, Canada, Iran, The Democratic People's Republic of Korea, Yemen and FATF blacklisted countries.
Making transactions on financial markets with marginal financial instruments opens up wide possibilities and allows investors who are willing to take risks to earn high profits, carrying a potentially high risk of losses at the same time. Therefore you should responsibly approach the issue of choosing the appropriate investment strategy, taking the available resources into account, before starting trading.
Use of the information: full or partial use of materials from this website must always be referenced to TeleTrade as the source of information. Use of the materials on the Internet must be accompanied by a hyperlink to teletrade.org. Automatic import of materials and information from this website is prohibited.
Please contact our PR department if you have any questions or need assistance at pr@teletrade.global.


