- Analytics
- News and Tools
- Market News
- Gold Price Forecast: XAU/USD declines towards $1,900 as spotlight shifts to Fed Powell’s speech
Gold Price Forecast: XAU/USD declines towards $1,900 as spotlight shifts to Fed Powell’s speech
- Gold price is declining towards the $1,900.00 support ahead of Fed Powell’s speech.
- Investors are cautious that hawkish remarks from Jerome Powell would propel fears of a recession in the US economy.
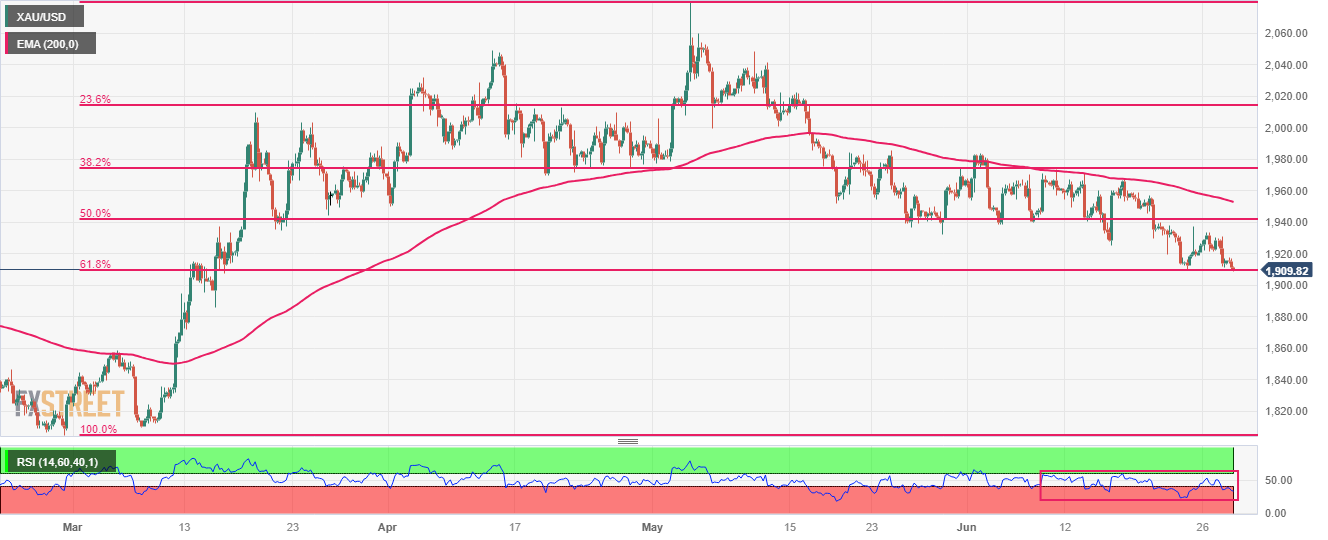
- Gold price has tumbled to near the 61.8% Fibonacci retracement at $1,909.00.
Gold price (XAU/USD) has challenged the crucial support of $1,910.00 in the London session. The precious metal is declining towards the psychological support of $1,900.00 as investors are expecting hawkish interest rate guidance from Federal Reserve (Fed) chair Jerome Powell.
S&P500 futures have posted decent losses overnight as investors are cautious that hawkish remarks from Jerome Powell would propel fears of a recession in the United States economy. According to HSBC Asset Management the US will enter a downturn in the fourth quarter, followed by a “year of contraction and a European recession in 2024.
The US Dollar Index (DXY) is struggling to sustain above the critical resistance of 102.60 despite the market mood has turned cautious. It is highly likely that Fed Powell would stick to the guidance delivered earlier that the central bank will hike interest rates at a ‘careful pace’. San Francisco Fed Bank President Mary Daly suggested that two more rate hikes this year is a “very reasonable” projection.
Meanwhile, the US Durable Goods Orders data (May) also remained resilient despite tight monetary policy by the Fed. The economic data expanded by 1.7% while the street was anticipating a contraction of 1%. May’s Durables data has outperformed April’s figure of 1.2%.
Gold technical analysis
Gold price has tumbled to near the 61.8% Fibonacci retracement (plotted from February 28 low at $1,804.76 to May 03 high at $2,079.76) at $1,909.00 on a four-hour scale. Downward-sloping 200-period Exponential Moving Average (EMA) at $1,952.74 indicates that more downside is in the pipeline.
The Relative Strength Index (RSI) (14) is oscillating in the bearish range of 20.00-60.00, which indicates that the downside momentum is active.
Gold four-hour chart

© 2000-2026. All rights reserved.
This site is managed by Teletrade D.J. LLC 2351 LLC 2022 (Euro House, Richmond Hill Road, Kingstown, VC0100, St. Vincent and the Grenadines).
The information on this website is for informational purposes only and does not constitute any investment advice.
The company does not serve or provide services to customers who are residents of the US, Canada, Iran, The Democratic People's Republic of Korea, Yemen and FATF blacklisted countries.
Making transactions on financial markets with marginal financial instruments opens up wide possibilities and allows investors who are willing to take risks to earn high profits, carrying a potentially high risk of losses at the same time. Therefore you should responsibly approach the issue of choosing the appropriate investment strategy, taking the available resources into account, before starting trading.
Use of the information: full or partial use of materials from this website must always be referenced to TeleTrade as the source of information. Use of the materials on the Internet must be accompanied by a hyperlink to teletrade.org. Automatic import of materials and information from this website is prohibited.
Please contact our PR department if you have any questions or need assistance at pr@teletrade.global.


