- Analytics
- News and Tools
- Market News
- Silver Price Analysis: XAG/USD plummets to a two-month low, below the 200-day EMA
Silver Price Analysis: XAG/USD plummets to a two-month low, below the 200-day EMA
- XAG/USD sinks below key $22.96, the 200-day EMA level.
- Bearish RSI and RoC indicate a strong sell-off, warranting further XAG/USD downside.
- XAG/USD upside resistance was found at a $23.00 handle, followed by a challenge of the 100-day EMA.
Silver price pierces below the 200-day Exponential Moving Average (EMA) of $22.96 as sellers pile in, dragging prices towards a new two-month low of $22.50, as high US Treasury bond yields pressure the precious metals segment. At the time of writing, XAG/USD trades at $22.75, while Gold (XAU/USD) spot exchanges hands at $1931.02, down 1.64% and 0.23%, respectively.
Risk-off sentiment is weighing on the precious metals segment. Investors remain uncertain as the Fed Chair Jerome Powell commences his two-day testimony at the US Congress, which you can follow here. The US 10-year Treasury note yields 3.775% and gains 4.6 bps, while US real yields, directly influencing XAG/USD’s prices, climb five bps to 1.555%.
XAG/USD Price Analysis: Technical outlook
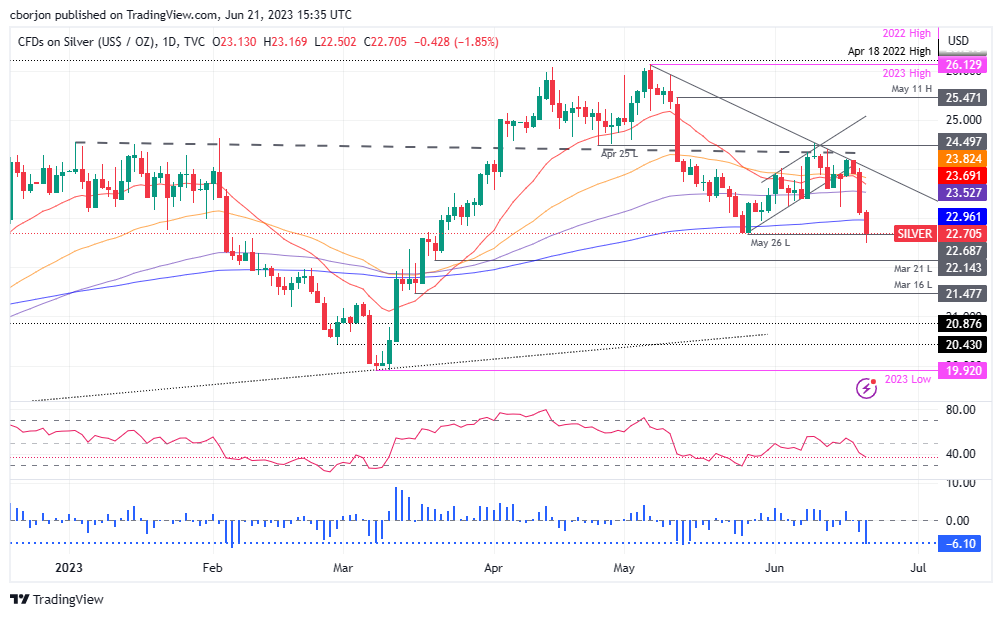
The XAG/USD remains neutral to downward biased, though it could shift to the downside if XAG/USD prints a daily close below the May 25 swing low of $22.68. That would mean the Silver price breaking the 200-day Exponential Moving Average (EMA) threshold and, from a technical perspective, turning XAG/USD bearish.
Further cementing XAG/USD bearish case is the Relative Strength Index (RSI) indicator at negative territory, while the three-day Rate of Change (RoC) continues to plunge as sellers gain momentum.
That said, in that outcome, XAG/USD could dive towards the March 21 daily low at $22.14 before challenging the $22.00 figure. A breach of the latter will expose the March 16 low at $21.47, followed by the $21.00 mark.
Conversely, if XAG/USD reclaims the 200-day EMA, that could expose the $23.00 handle on the upside, followed by the 100-day EMA at $23.52.
XAG/USD Price Action – Daily chart

© 2000-2026. All rights reserved.
This site is managed by Teletrade D.J. LLC 2351 LLC 2022 (Euro House, Richmond Hill Road, Kingstown, VC0100, St. Vincent and the Grenadines).
The information on this website is for informational purposes only and does not constitute any investment advice.
The company does not serve or provide services to customers who are residents of the US, Canada, Iran, The Democratic People's Republic of Korea, Yemen and FATF blacklisted countries.
Making transactions on financial markets with marginal financial instruments opens up wide possibilities and allows investors who are willing to take risks to earn high profits, carrying a potentially high risk of losses at the same time. Therefore you should responsibly approach the issue of choosing the appropriate investment strategy, taking the available resources into account, before starting trading.
Use of the information: full or partial use of materials from this website must always be referenced to TeleTrade as the source of information. Use of the materials on the Internet must be accompanied by a hyperlink to teletrade.org. Automatic import of materials and information from this website is prohibited.
Please contact our PR department if you have any questions or need assistance at pr@teletrade.global.


