- Analytics
- News and Tools
- Market News
- NZD/USD bounces toward 0.6100 after US labour market data
NZD/USD bounces toward 0.6100 after US labour market data
- The NZD/USD pair jumped above 0.6090 showing a 0.95% increase on the day.
- US Initial Jobless Claims for the week ending on June 2 increased to 261K.
- Falling US yields amid dovish bets on the Fed weakened the US Dollar.
The NZD/USD pair experienced a significant surge, surpassing the 0.6090 level and marking a 0.95% increase on the day. This rise was influenced by multiple factors, including the US Initial Jobless Claims for the week ending June 2, which unexpectedly accelerated, fueling dovish expectations towards the upcoming Federal Reserve (Fed) meeting. The USD lost interest on the back of falling US bond yields.
US bond yields decline following Jobless Claims data, eyes on CPI
US Initial Jobless Claims for the week ending on June 2 came in at 261K vs the 235K expected and accelerated from its previous reading of 233K. The rising number of people claiming unemployment benefits in the US hints at weakness in the labour market amid the contractive monetary policy by the Federal Reserve (Fed) which makes investors foresee a less aggressive stance for the upcoming meetings. The CME FedWatch Tool suggests that investors are placing higher probabilities on the Fed refraining from hiking rates in the next meeting scheduled for June 13-14, and instead, keeping the target rate steady at 5.25%.
Against this backdrop, US bond yields slid across the curve with the 2-, 5- and 10-year rates lower on the day.
The forthcoming US Consumer Price Index (CPI) data is expected to play the most crucial role in determining the Fed decision. Analysts predict a decrease in the year-on-year headline inflation rate to 4.2% in May from the previous 4.9%, while the core rate is anticipated to rise to 5.6% from its previous reading of 5.5%.
NZD/USD levels to watch
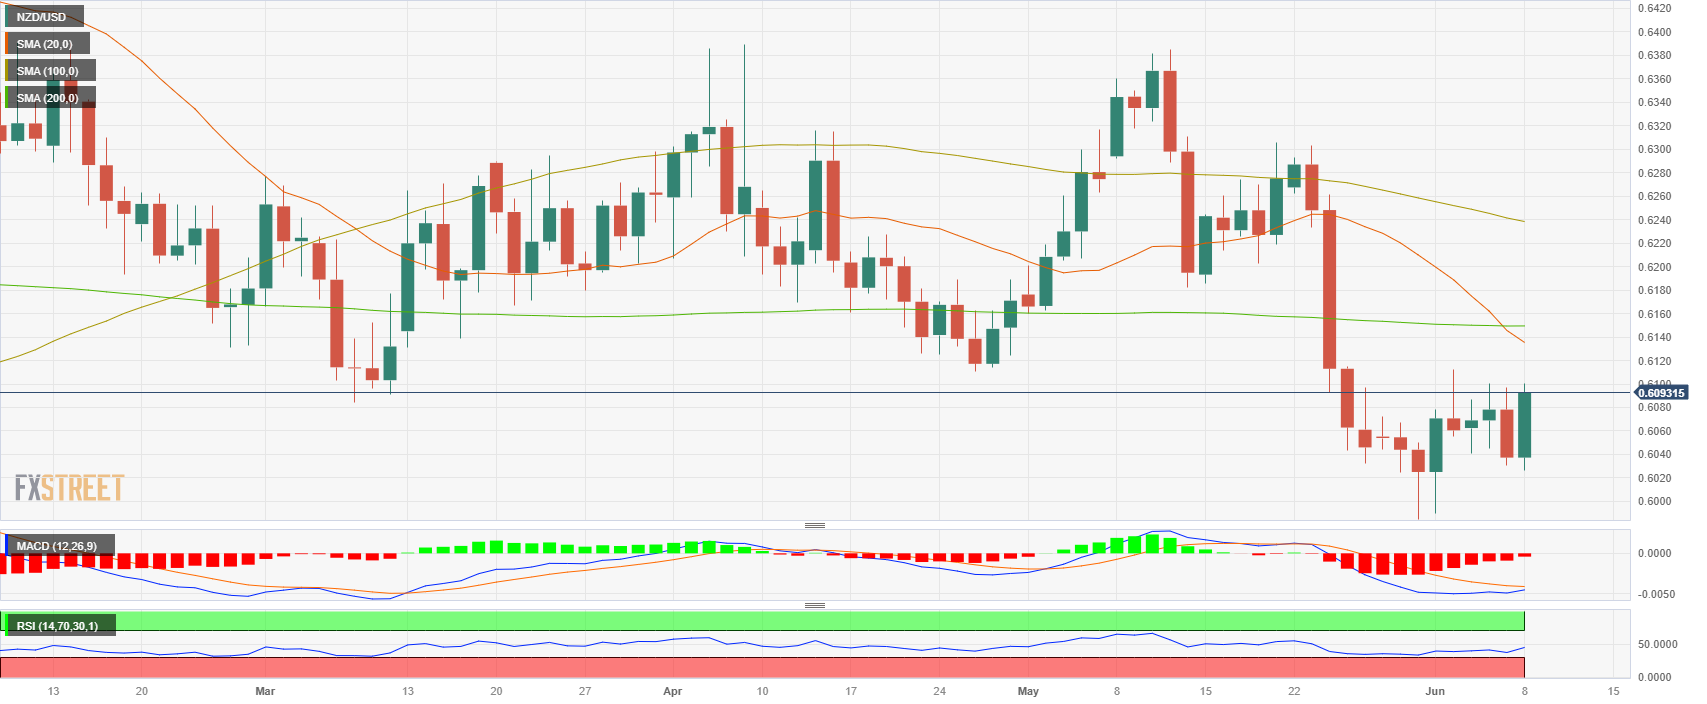
According to the daily chart, the NZD/USD holds a short-term neutral to bearish outlook. Despite technical indicator showing growing bullish momentum, the bearish cross performed by the 20-day Simple Moving Average (SMA) sliding below the 200-day SMA suggests that the negative outlook for the NZD is intact.
On the downside, support levels line up at 0.6050, 0.6030 and the psychological mark of 0.6000. On the other hand, immediate resistance is seen at 0.6115, followed by the 0.6130 - 0.6150 zone, where the mentioned SMAs charted the bearish cross.
NZD/USD daily chart

© 2000-2026. All rights reserved.
This site is managed by Teletrade D.J. LLC 2351 LLC 2022 (Euro House, Richmond Hill Road, Kingstown, VC0100, St. Vincent and the Grenadines).
The information on this website is for informational purposes only and does not constitute any investment advice.
The company does not serve or provide services to customers who are residents of the US, Canada, Iran, The Democratic People's Republic of Korea, Yemen and FATF blacklisted countries.
Making transactions on financial markets with marginal financial instruments opens up wide possibilities and allows investors who are willing to take risks to earn high profits, carrying a potentially high risk of losses at the same time. Therefore you should responsibly approach the issue of choosing the appropriate investment strategy, taking the available resources into account, before starting trading.
Use of the information: full or partial use of materials from this website must always be referenced to TeleTrade as the source of information. Use of the materials on the Internet must be accompanied by a hyperlink to teletrade.org. Automatic import of materials and information from this website is prohibited.
Please contact our PR department if you have any questions or need assistance at pr@teletrade.global.


