- Analytics
- News and Tools
- Market News
- EUR/USD Price Analysis: Upside seems limited, bearish pennant in the making
EUR/USD Price Analysis: Upside seems limited, bearish pennant in the making
- EUR/USD edges higher and retakes the 1.0700 mark during the Asian session on Thursday.
- A mildly softer tone around the USD is seen as a key factor lending support to the major.
- The formation of a bearish pennant warrants caution before positioning for further gains.
The EUR/USD pair attracts some buying following the overnight pullback from the weekly high and climbs back above the 1.0700 mark during the Asian session on Thursday.
The uncertainty over the Federal Reserve's (Fed) rate-hike path keeps the US Dollar (USD) bulls on the defensive, which, in turn, is seen lending some support to the EUR/USD pair. That said, surprise rate hikes by the Reserve Bank of Australia (RBA) and the Bank of Canada (BoC) this week suggest that the fight against inflation is not over yet. This supports prospects for a further policy tightening by the Fed, which remains supportive of elevated US Treasury bond yields and favours the USD bulls.
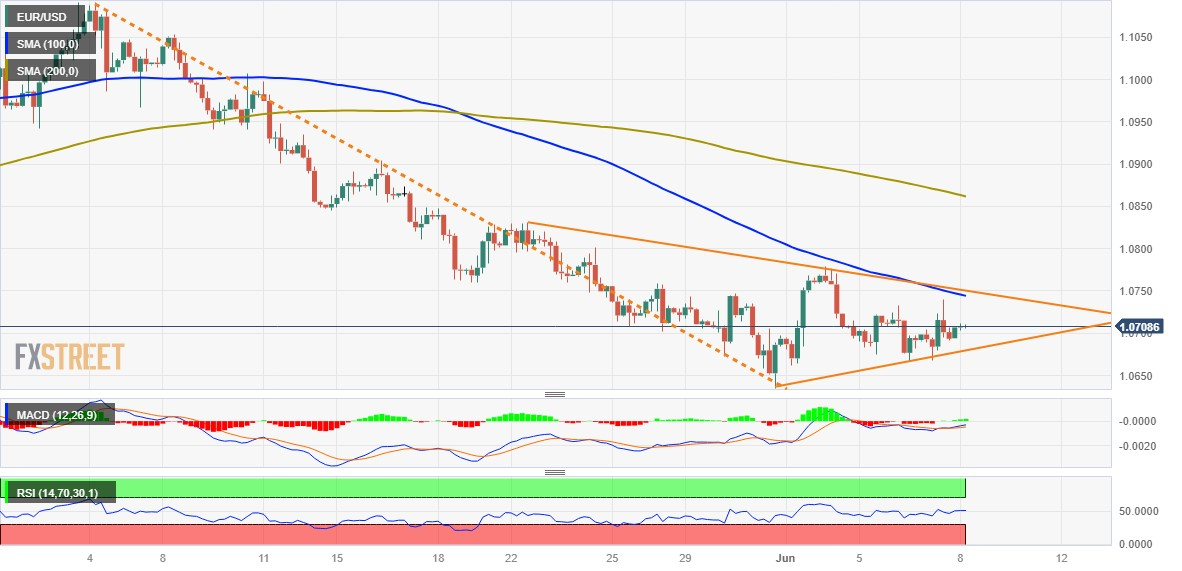
From a technical perspective, the recent price action between two converging trend lines constitutes the formation of a bearish pennant on hourly charts. This comes on the back of the recent breakdown through the 100-day Simple Moving Average (SMA) and suggests that the path of least resistance for the EUR/USD pair is to the downside. Bearish traders, however, need to wait for weakness below the symmetrical triangle support, currently near the 1.0680-1.0675 region, before placing fresh bets.
The latter is followed by the 1.0635 area, or over a two-month low touched last week, and the 1.0600 round-figure mark. Some follow-through selling will be seen as a fresh trigger for bearish traders and drag the EUR/USD pair towards intermediate support near the 1.0540-1.0535 area en route to the 1.0500 psychological mark. The latter coincides with the very important 200-day SMA and should help protect any further losses ahead of the highly-anticipated FOMC meeting next week.
On the flip side, the top end of the aforementioned symmetrical triangle, currently around the 1.0745-1.0750 area, coincides with the 100-period SMA on the 4-hour chart. A convincing breakthrough could trigger a short-covering rally and allow the EUR/USD pair to reclaim the 1.0800 mark. The upward trajectory could get extended further towards testing the next relevant hurdle near the 1.0865-1.0870 region, representing the 200-period SMA on the 4-hour chart.
EUIR/USD 4-hour chart

Key levels to watch
© 2000-2026. All rights reserved.
This site is managed by Teletrade D.J. LLC 2351 LLC 2022 (Euro House, Richmond Hill Road, Kingstown, VC0100, St. Vincent and the Grenadines).
The information on this website is for informational purposes only and does not constitute any investment advice.
The company does not serve or provide services to customers who are residents of the US, Canada, Iran, The Democratic People's Republic of Korea, Yemen and FATF blacklisted countries.
Making transactions on financial markets with marginal financial instruments opens up wide possibilities and allows investors who are willing to take risks to earn high profits, carrying a potentially high risk of losses at the same time. Therefore you should responsibly approach the issue of choosing the appropriate investment strategy, taking the available resources into account, before starting trading.
Use of the information: full or partial use of materials from this website must always be referenced to TeleTrade as the source of information. Use of the materials on the Internet must be accompanied by a hyperlink to teletrade.org. Automatic import of materials and information from this website is prohibited.
Please contact our PR department if you have any questions or need assistance at pr@teletrade.global.


