- Analytics
- News and Tools
- Market News
- NZD/USD Price Analysis: Needs a break above 0.6100 to validate Inverted H&S formation
NZD/USD Price Analysis: Needs a break above 0.6100 to validate Inverted H&S formation
- NZD/USD has attempted a recovery move after correcting to near 0.6070.
- The street is in a tug of war between weak US economic activities and bumper employee additions in the labor market.
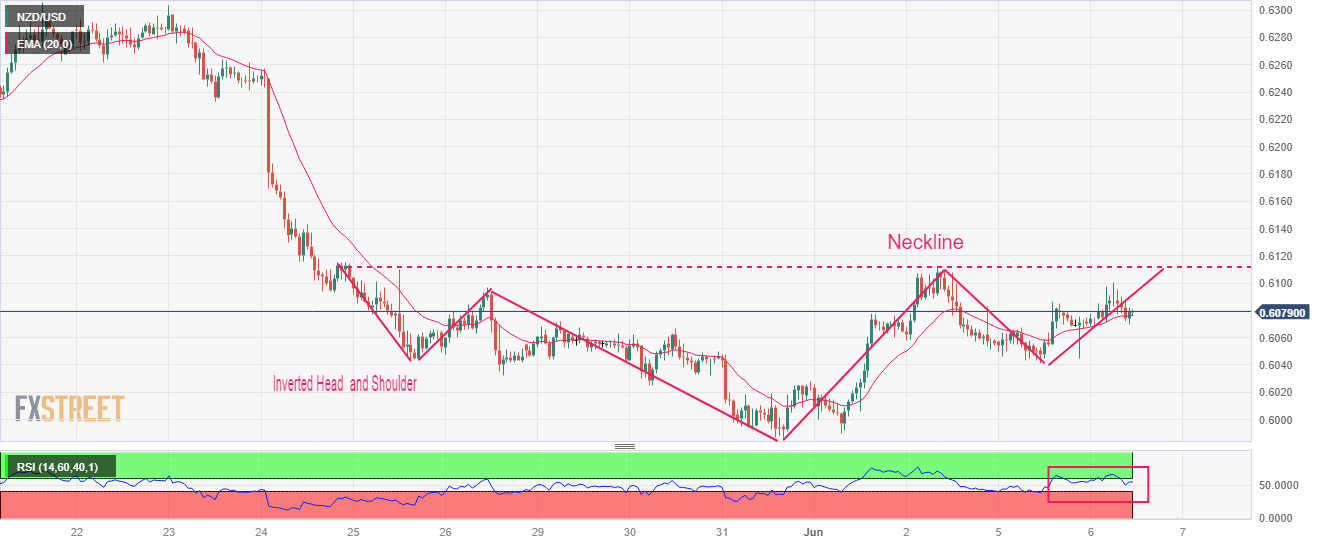
- NZD/USD is forming an Inverted Head and Shoulder chart pattern whose breakout propels a bullish reversal.
The NZD/USD pair has attempted a recovery move after correcting to near 0.6070 in the London session. The Kiwi asset is expected to show volatile moves amid an absence of critical triggers.
The US Dollar Index (DXY) has extended its solid recovery to near 104.20 despite the street is mixed about interest rate policy by the Federal Reserve (Fed) for June’s meeting. The street is in a tug of war between weak economic activities and bumper employee additions in the labor market.
Meanwhile, world’s second largest economy has asked its biggest banks to slash down deposit rates in order to boost the economic prospects. Higher liquidity flush into the economy would allow firms to utilize their full capacity. It is worth noting that New Zealand is one of the leading trading partners of China and higher factor and service activities in China will support the New Zealand Dollar.
NZD/USD is forming an Inverted Head and Shoulder chart pattern on an hourly scale, which indicates a prolonged consolidation, and a breakout of the same results in a bullish reversal. The neckline of the aforementioned chart pattern is plotted from May 25 high at 0.6110.
The 20-period Exponential Moving Average (EMA) at 0.6076 is providing cushion to the Kiwi bulls.
Meanwhile, the Relative Strength Index (RSI) (14) is making efforts for shifting into the bullish range of 60.00-80.00. An occurrence of the same will trigger an upside momentum.
A confident break above May 25 high at 0.6110 will drive the Kiwi asset toward May 01 low at 0.6160 followed by the round-level resistance at 0.6200.
Alternatively, a downside move below the intraday low at 0.6015 will expose the asset for a fresh six-month low toward 11 November 2022 low at 0.5984. A slippage below the latter would expose the asset toward 02 November 2022 high at 0.5941.
NZD/USD hourly chart

© 2000-2026. All rights reserved.
This site is managed by Teletrade D.J. LLC 2351 LLC 2022 (Euro House, Richmond Hill Road, Kingstown, VC0100, St. Vincent and the Grenadines).
The information on this website is for informational purposes only and does not constitute any investment advice.
The company does not serve or provide services to customers who are residents of the US, Canada, Iran, The Democratic People's Republic of Korea, Yemen and FATF blacklisted countries.
Making transactions on financial markets with marginal financial instruments opens up wide possibilities and allows investors who are willing to take risks to earn high profits, carrying a potentially high risk of losses at the same time. Therefore you should responsibly approach the issue of choosing the appropriate investment strategy, taking the available resources into account, before starting trading.
Use of the information: full or partial use of materials from this website must always be referenced to TeleTrade as the source of information. Use of the materials on the Internet must be accompanied by a hyperlink to teletrade.org. Automatic import of materials and information from this website is prohibited.
Please contact our PR department if you have any questions or need assistance at pr@teletrade.global.


