- Analytics
- News and Tools
- Market News
- GBP/USD Price Analysis: Remains inside falling wedge ahead of UK Inflation
GBP/USD Price Analysis: Remains inside falling wedge ahead of UK Inflation
- GBP/USD is displaying a sideways auction as the focus has shifted to UK Inflation.
- BoE Bailey reiterated that they must use the tool of interest rate rises carefully.
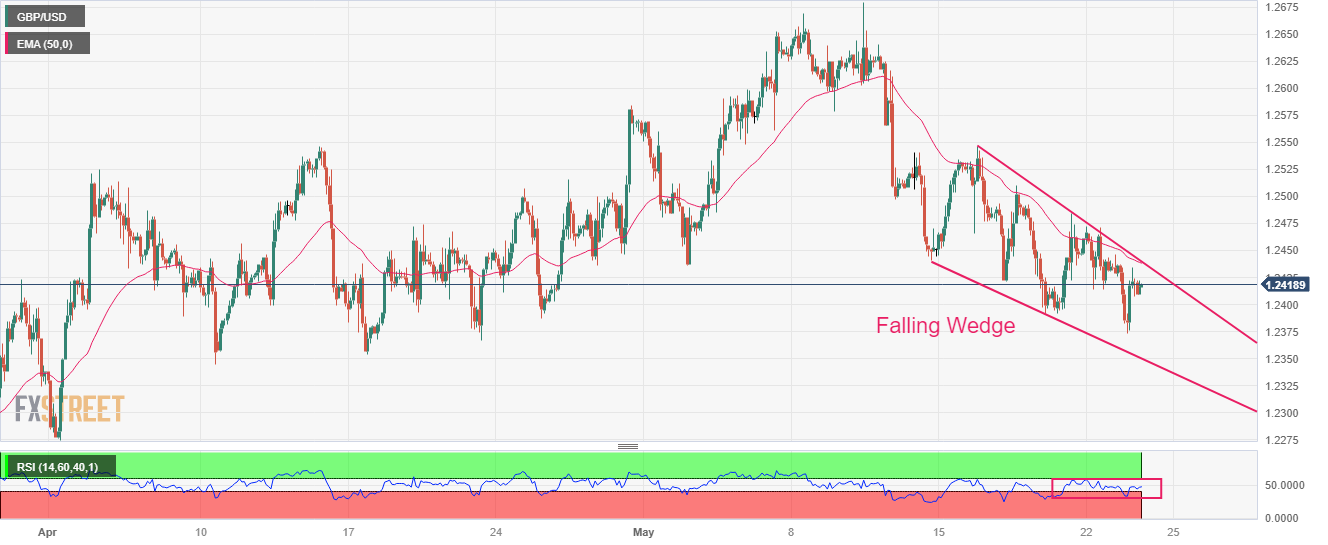
- GBP/USD is auctioning in a Falling Wedge pattern in which each pullback is considered as a selling opportunity.
The GBP/USD pair is displaying a back-and-forth action around 1.2420 in the early Tokyo session. Earlier, the Cable showed significant recovery after defending the downside near 1.2380. A power-pack action is anticipated from the Pound Sterling ahead of the United Kingdom’s Consumer Price Index (CPI) data (April).
Headline inflation is seen softening sharply to 8.2% from the former release of 10.1%. The core CPI is expected to remain steady at 6.2%. On Tuesday, Bank of England (BoE) Governor Andrew Bailey said "I think we are nearer to the peak than we were” and reiterated that they must use the tool of interest rate rises carefully.
The US Dollar Index (DXY) is looking to surpass the crucial resistance of 103.62 amid US debt-ceiling issues. International Monetary Fund (IMF) Managing Director Kristalina Georgieva cited on Tuesday that "A lack of solution would have a detrimental impact on the US and world economy,” "Hopefully we won't have to wait to the 11th hour for a solution on the US debt-ceiling."
GBP/USD is auctioning in a Falling Wedge chart pattern on a two-hour scale in which each pullback is considered a selling opportunity by the market participants. Also, the chances of a bullish reversal remain higher. The 50-period Exponential Moving Average (EMA) at 1.2440 is acting as a barrier for the Pound Sterling bulls.
Meanwhile, a 40.00-60.00 range oscillation by the Relative Strength Index (RSI) (14) will get a decisive move after the release of the UK Inflation.
Should the asset decline below May 19 low at 1.2390, US Dollar bulls will get strengthened further and will drag the Cable toward April 10 low at 1.2344 followed by April 03 low at 1.2275.
On the flip side, a recovery move above May 09 high at 1.2640 will drive the major toward the round-level resistance at 1.2700 and 26 April 2022 high at 1.2772.
GBP/USD two-hour chart

© 2000-2026. All rights reserved.
This site is managed by Teletrade D.J. LLC 2351 LLC 2022 (Euro House, Richmond Hill Road, Kingstown, VC0100, St. Vincent and the Grenadines).
The information on this website is for informational purposes only and does not constitute any investment advice.
The company does not serve or provide services to customers who are residents of the US, Canada, Iran, The Democratic People's Republic of Korea, Yemen and FATF blacklisted countries.
Making transactions on financial markets with marginal financial instruments opens up wide possibilities and allows investors who are willing to take risks to earn high profits, carrying a potentially high risk of losses at the same time. Therefore you should responsibly approach the issue of choosing the appropriate investment strategy, taking the available resources into account, before starting trading.
Use of the information: full or partial use of materials from this website must always be referenced to TeleTrade as the source of information. Use of the materials on the Internet must be accompanied by a hyperlink to teletrade.org. Automatic import of materials and information from this website is prohibited.
Please contact our PR department if you have any questions or need assistance at pr@teletrade.global.


