- Analytics
- News and Tools
- Market News
- USD/JPY Price Analysis: Surges to new YTD high, bolstered by US data, high bond yields
USD/JPY Price Analysis: Surges to new YTD high, bolstered by US data, high bond yields
- USD/JPY rally driven by positive sentiment around US debt ceiling talks, solid US job data, and upbeat retail and industrial figures.
- Despite breaching the resistance at 138.00, potential resistance levels at 139.00 and 139.89 might cap gains, with the psychological 140.00 mark as the next target.
- While signs of overbought conditions emerge, suggesting potential for a downward correction, the overall bullish trend remains solid.
USD/JPY climbs to new year-to-date (YTD) highs of 138.67, bolstered by higher US Treasury bond yields, amidst an upbeat sentiment sponsored by improvement in the US debt ceiling talks. In addition, solid US jobs data, alongside strong Retail Sales, Industrial Production, and a surprising hawkish comment by Dallas Fed President Lorie Logan, propelled the USD/JPY. At the time of writing, the USD/JPY is trading at 138.57 after hitting a low of 137.28.
USD/JPY Price Analysis: Technical outlook
The USD/JPY daily chart shows the pair remains in a solid uptrend after breaking a resistance trendline alongside the 138.00 figure. On the upside, the USD/JPY will clash with solid resistance levels like the 139.00 figure, followed by the November 30 daily high of 139.89. A decisive break will expose the 140.00 psychological figure. On the other hand, if USD/JPY drops below 138.00, it will exacerbate a correction toward the 20-day Exponential Moving Average (EMA) at 135.52.
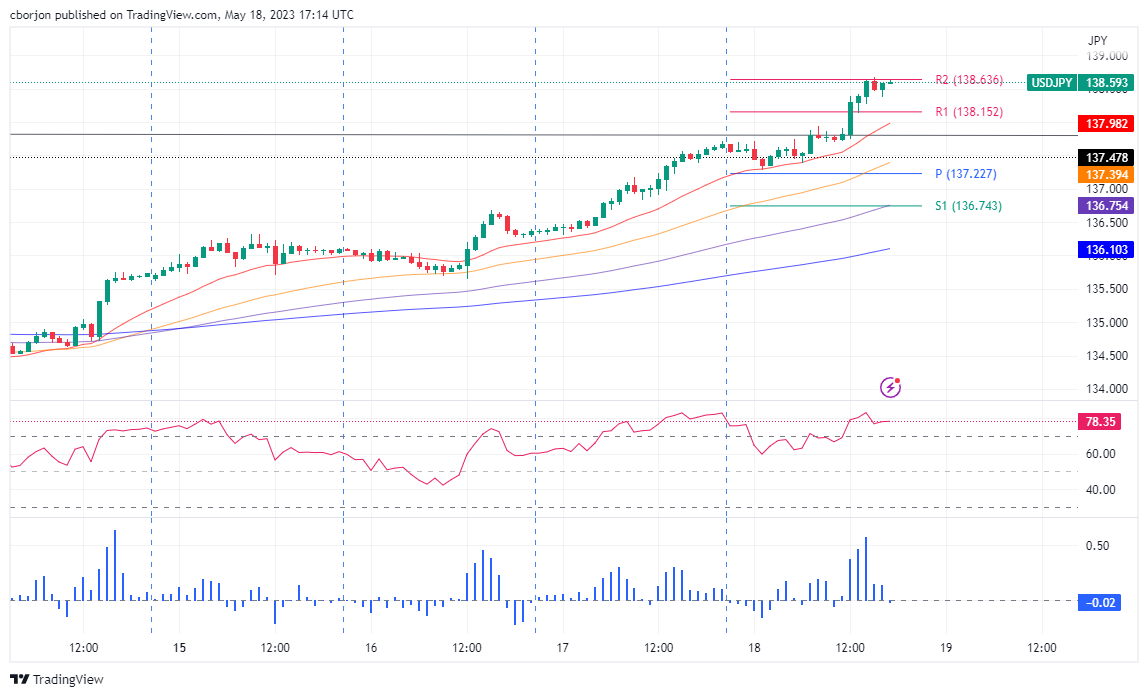
In the short term, the USD/JPY 1-hour chart, the pair peaked around the R2 daily pivot, with two subsequent attempts to clear the latter, as buyers are eyeing the 139.00 figure. If USD/JPY fails to crack the R2 daily pivot level, a pullback toward the R1 pivot at 138.15 is on the cards before reaching the 20-EMA at 137.98.
The Relative Strength Index (RSI) indicators at overbought territory register lower peaks as price action reaches higher highs. That means negative divergence forms, opening the door for a downward correction. In addition, the 3-period Rate of Change (RoC) shows buyers losing momentum.
USD/JPY Price Action – 1-Hour chart

© 2000-2026. All rights reserved.
This site is managed by Teletrade D.J. LLC 2351 LLC 2022 (Euro House, Richmond Hill Road, Kingstown, VC0100, St. Vincent and the Grenadines).
The information on this website is for informational purposes only and does not constitute any investment advice.
The company does not serve or provide services to customers who are residents of the US, Canada, Iran, The Democratic People's Republic of Korea, Yemen and FATF blacklisted countries.
Making transactions on financial markets with marginal financial instruments opens up wide possibilities and allows investors who are willing to take risks to earn high profits, carrying a potentially high risk of losses at the same time. Therefore you should responsibly approach the issue of choosing the appropriate investment strategy, taking the available resources into account, before starting trading.
Use of the information: full or partial use of materials from this website must always be referenced to TeleTrade as the source of information. Use of the materials on the Internet must be accompanied by a hyperlink to teletrade.org. Automatic import of materials and information from this website is prohibited.
Please contact our PR department if you have any questions or need assistance at pr@teletrade.global.


