- Analytics
- News and Tools
- Market News
- USD/MXN makes a comeback as US Dollar recovers vs. the Mexican Peso
USD/MXN makes a comeback as US Dollar recovers vs. the Mexican Peso
- USD/MXN climbs back above 17.80 at the beginning of the week.
- Inflation data this week to shed light on Fed’s June meeting.
- Mexican inflation figures to give USD/MXN traders clues for Banxico’s monetary policy meeting on May 18.
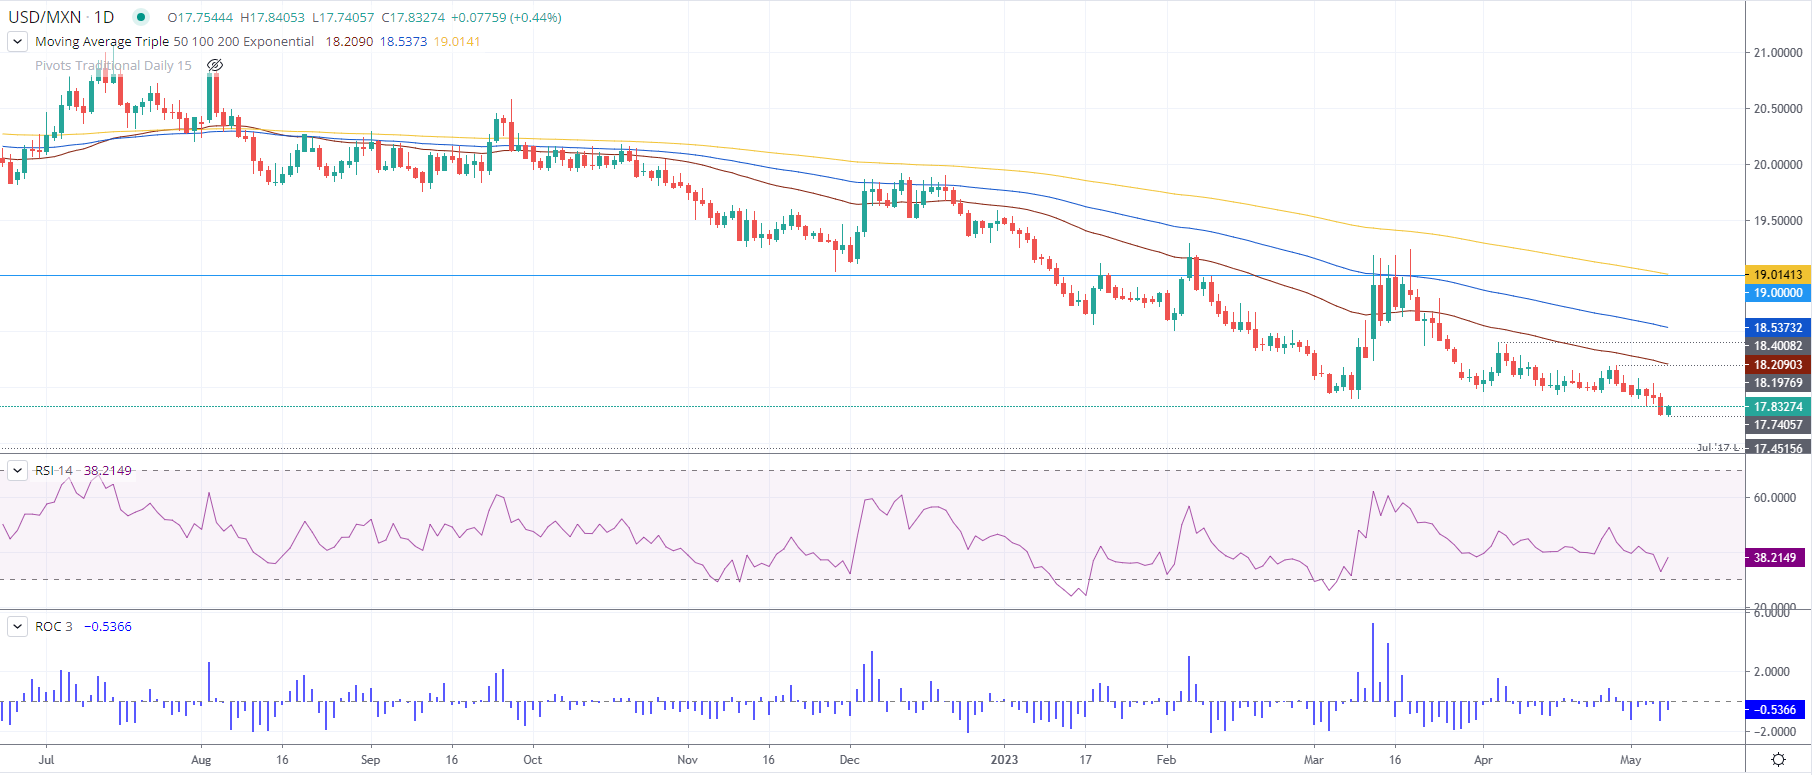
The USD/MXN makes a U-turn and climbs back above the 17.80 figure at the beginning of the week, as US Treasury bond yields edge up, while a risk-off impulse keeps Wall Street in the red. Solid data from the United States (US) cushioned the last week’s USD/MXN fall. At the same time, speculations that the Mexican central bank will pause its tightening cycle could trigger outflows from the emerging market currency. At the time of writing, the USD/MXN is trading at 17.8354.
US Dollar recovery, on speculations of Mexican central bank pausing tightening cycle
The US Dollar (USD) has shown signs of recovery against the Mexican Peso (MXN). Last Friday, the latest US jobs report showed signs of tightness, which warrants further action by the US Federal Reserve (Fed). Even though the Fed opened the door for a pause on its tightening cycle, this week’s inflation data could shed some light on what the Fed can do in June’s meeting.
Meanwhile, discussions about the US debt ceiling shifted sentiment sour. According to Janet Yellen, the US Treasury Secretary, there are no favorable alternatives to resolve the debt limit issue in Washington without assistance from the US Congress.
The US economic docket revealed data from the US Department of Commerce. Wholesale Inventories for March came at 0% MoM, below estimates of 0.1% expansion, though annually-based figures showed an improvement.
On the Mexican front, the agenda is empty for Monday. Still, on Tuesday, inflation figures would give USD/MXN traders some clues regarding the Bank of Mexico’s (Banxico) path toward its May 18 monetary policy meeting.
USD/MXN Technical Analysis

Once the USD/MXN found its floor around 17.7405, hitting six-year lows, the USD/MXN jumped off the year-to-date (YTD) low toward the 17.80 area. Even though the USD/MXN is still downward biased, a divergence between the Relative Strength Index (RSI) indicator printing higher troughs while the USD/MXN pair registers lower lows suggests that selling pressure is fading. If USD/MXN climbs above 18.0000, that will expose the 50-day EMA at 18.2087. A breach of the latter and above the April 26 high would open the door to test April’s high of 18.4008, followed by the 100-day EMA at 18.5371.
© 2000-2026. All rights reserved.
This site is managed by Teletrade D.J. LLC 2351 LLC 2022 (Euro House, Richmond Hill Road, Kingstown, VC0100, St. Vincent and the Grenadines).
The information on this website is for informational purposes only and does not constitute any investment advice.
The company does not serve or provide services to customers who are residents of the US, Canada, Iran, The Democratic People's Republic of Korea, Yemen and FATF blacklisted countries.
Making transactions on financial markets with marginal financial instruments opens up wide possibilities and allows investors who are willing to take risks to earn high profits, carrying a potentially high risk of losses at the same time. Therefore you should responsibly approach the issue of choosing the appropriate investment strategy, taking the available resources into account, before starting trading.
Use of the information: full or partial use of materials from this website must always be referenced to TeleTrade as the source of information. Use of the materials on the Internet must be accompanied by a hyperlink to teletrade.org. Automatic import of materials and information from this website is prohibited.
Please contact our PR department if you have any questions or need assistance at pr@teletrade.global.


