- Analytics
- News and Tools
- Market News
- Gold Price Forecast: XAU/USD continues to remain sideways around $2,050 as focus turns to US job data
Gold Price Forecast: XAU/USD continues to remain sideways around $2,050 as focus turns to US job data
- Gold price is in a sideways auction around $2,050.00 ahead of the US Employment data.
- The Fed is likely to restrict itself from raising rates further amid deepening US banking crisis, and slower growth rate.
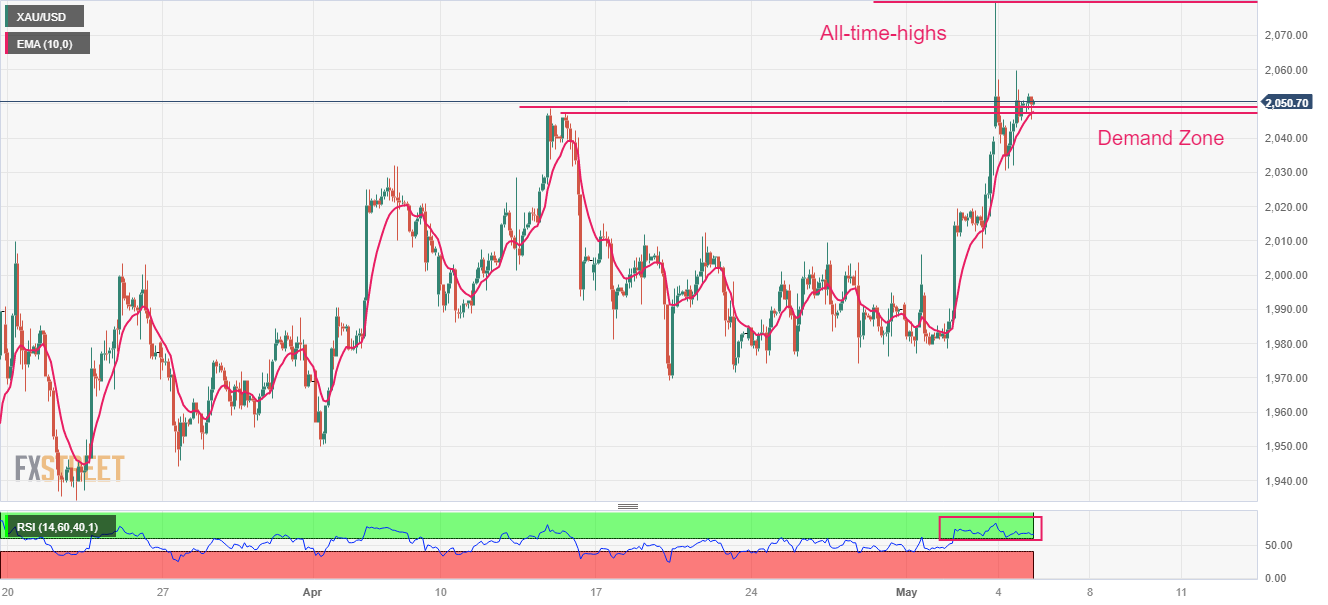
- Gold price is building a base near the demand zone plotted in a narrow range around $2,050.00.
Gold price (XAU/USD) is showing signs of volatility contraction around $2,050.00 in the Asian session. The precious metal is struggling to make a decisive move as investors are awaiting the release of the United States Nonfarm Payrolls (NFP) data for further action.
The US Dollar Index (DXY) is failing to find an intermediate cushion and is declining firmly. The USD Index has dropped to near 101.16 as the Federal Reserve (Fed) is likely to restrict itself from raising interest rates further amid deepening US banking crisis, slower growth rate, and easing US labor market conditions.
On Thursday, weekly Initial Jobless Claims for the week ending April 28 jumped to 242K vs. the consensus of 240K and the former release of 229K.
However, the street would get more clarity after the release of the US Nonfarm Payrolls (NFP) data. As per the consensus, the US labor market witnessed a fresh addition of 179K payrolls in April, which was lower than former additions of 236K. The catalyst that will hijack the attention of investors would be the Average Hourly Earnings data. The street is anticipating steady earnings numbers, however, a better-than-expected print would renew fears of recovery in inflationary pressures.
Apart from that any development on debt ceiling concerns would turn the USD Index extremely volatile.
Gold technical analysis
Gold price is building a base near the demand zone plotted in a narrow range around $2,050.00 on a two-hour scale. The precious metal fell sharply after printing an all-time high of $2,079.77. The 10-period Exponential Moving Average (EMA) at $2,047.00 is providing cushion to the Gold bulls.
Meanwhile, the Relative Strength Index (RSI) (14) is still oscillating in the bullish range of 60.00-80.00, indicating that the upside bias is holding momentum.
Gold two-hour chart

© 2000-2026. All rights reserved.
This site is managed by Teletrade D.J. LLC 2351 LLC 2022 (Euro House, Richmond Hill Road, Kingstown, VC0100, St. Vincent and the Grenadines).
The information on this website is for informational purposes only and does not constitute any investment advice.
The company does not serve or provide services to customers who are residents of the US, Canada, Iran, The Democratic People's Republic of Korea, Yemen and FATF blacklisted countries.
Making transactions on financial markets with marginal financial instruments opens up wide possibilities and allows investors who are willing to take risks to earn high profits, carrying a potentially high risk of losses at the same time. Therefore you should responsibly approach the issue of choosing the appropriate investment strategy, taking the available resources into account, before starting trading.
Use of the information: full or partial use of materials from this website must always be referenced to TeleTrade as the source of information. Use of the materials on the Internet must be accompanied by a hyperlink to teletrade.org. Automatic import of materials and information from this website is prohibited.
Please contact our PR department if you have any questions or need assistance at pr@teletrade.global.


