- Analytics
- News and Tools
- Market News
- Gold Price Forecast: XAU/USD holds steady around $1990s after data shows persistent inflation
Gold Price Forecast: XAU/USD holds steady around $1990s after data shows persistent inflation
- Gold price makes minor gains as stickier inflation prompts the Federal Reserve to tighten.
- CME FedWatch Tool indicates the odds of a Fed rate hike at 83.1%.
- XAU/USD Price Analysis: To test the YTD high above $2009.75; otherwise, it could challenge the 50-day EMA.
Gold price registers minimal gains, as traders brace for the weekend, gains 0.16%% after data from the United States (US) showed that inflation remains at high levels, justifying the need for further tightening by the US Federal Reserve. After hitting a daily low of 1976.31, the XAU/USD is trading at $1992.93, up 0.28%.
Gold price edged high but was capped within the weekly trading range
US equities continued to climb. A report by the US Department of Commerce showed inflation in the United States had decelerated, with the Personal Consumption Expenditure (PCE) rate slowing from 5.1% to 4.2% in YoY readings. The monthly growth rate increased to 0.1%, below the prior month’s 0.3%. Despite this deceleration, the Fed’s preferred gauge for inflation, the core PCE, remained unchanged at 4.6% YoY, suggesting that inflationary pressures remain stickier than estimates. As a result, investors continued to believe that the Fed would raise rates.
That’s shown by the CME FedWatch Tool, with odds for a 25 bps increase at 83.1, lower than the previous day’s 83.9% chances.
Gold prices remained supported by falling US Treasury bond yields. As of writing, the 2-year Treasury bond yield drops 3.5 bps and yields 4.039%, while the 10-year benchmark note rate sits at 3.443% and collapses 8 bps.
In other data, the University of Michigan (UoM) Consumer Sentiment remained unchanged at 63.5, with inflation expectations for 1-year standing at 4.6% and a 5-year horizon at 3%.
XAU/USD Technical Analysis

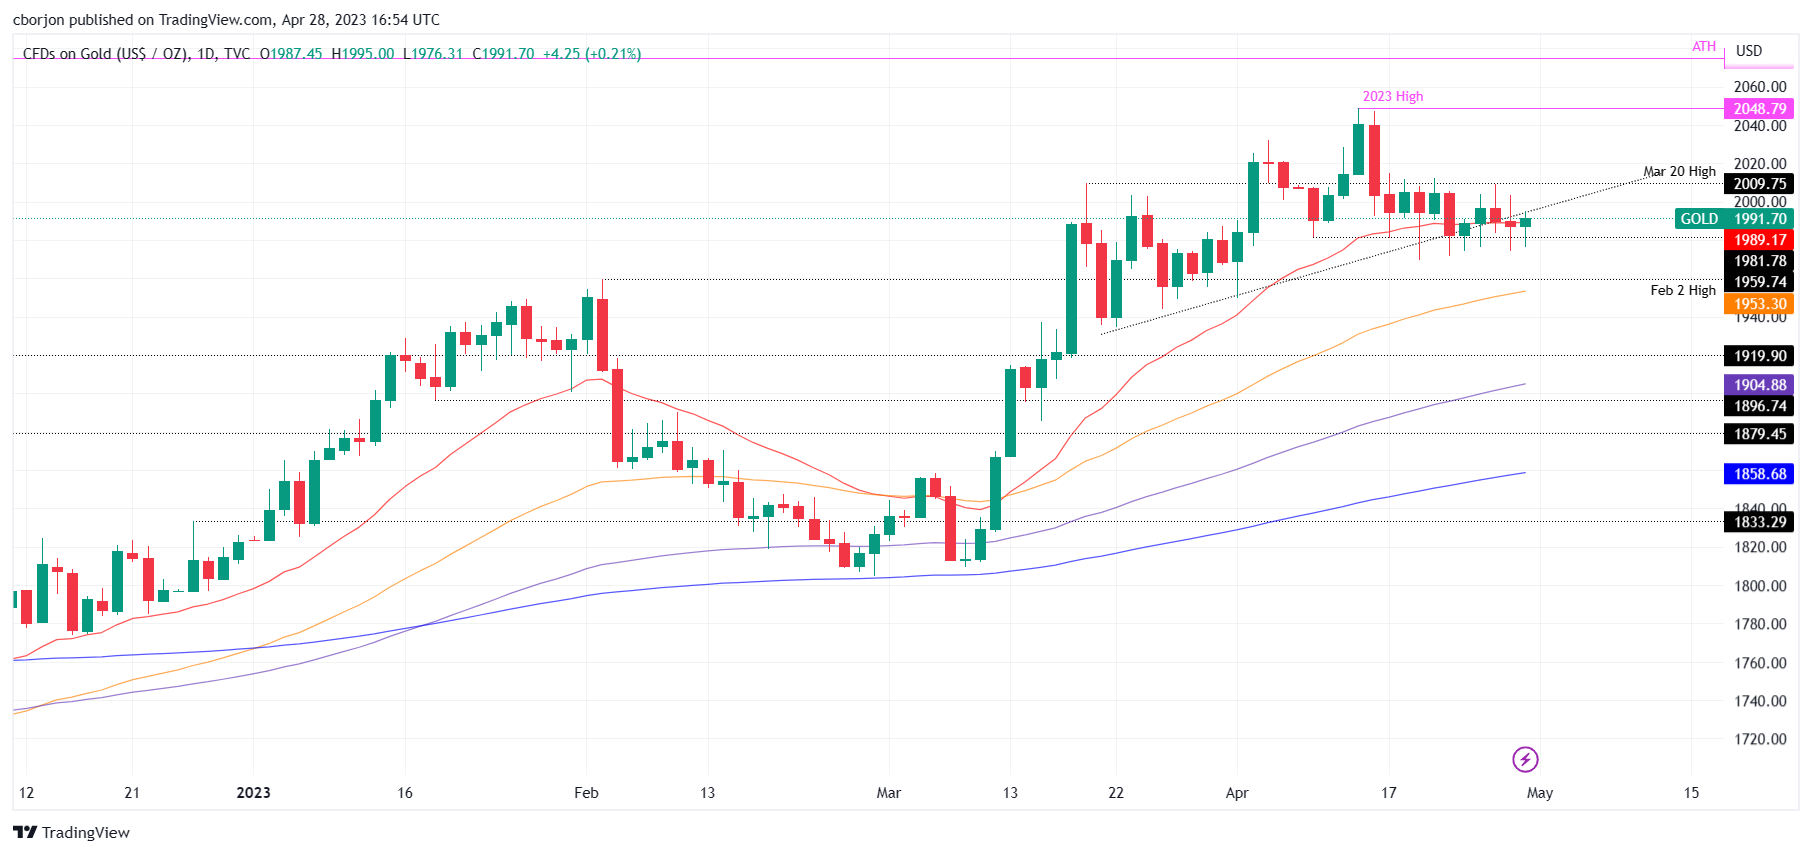
During the week, XAU/USD faltered to break below/above the $1970-$2010 range, hovering on each side of the 20-day Exponential Moving Average (EMA) at $1989.35. Although the latter was broken four times weekly, the EMA turned flat, suggesting that sideways trading will continue in the XAU/USD.
If XAU/USD reclaims $2000, further upside is expected, and a challenge to March’s 20 high at $2009.75 in on the cards. A breach of it will expose the YTD high at $2048.79. Conversely, the XAU/USD first support would be $1970. A decisive break will expose the 50-day EMA at $1953.34.
What to watch?

© 2000-2026. All rights reserved.
This site is managed by Teletrade D.J. LLC 2351 LLC 2022 (Euro House, Richmond Hill Road, Kingstown, VC0100, St. Vincent and the Grenadines).
The information on this website is for informational purposes only and does not constitute any investment advice.
The company does not serve or provide services to customers who are residents of the US, Canada, Iran, The Democratic People's Republic of Korea, Yemen and FATF blacklisted countries.
Making transactions on financial markets with marginal financial instruments opens up wide possibilities and allows investors who are willing to take risks to earn high profits, carrying a potentially high risk of losses at the same time. Therefore you should responsibly approach the issue of choosing the appropriate investment strategy, taking the available resources into account, before starting trading.
Use of the information: full or partial use of materials from this website must always be referenced to TeleTrade as the source of information. Use of the materials on the Internet must be accompanied by a hyperlink to teletrade.org. Automatic import of materials and information from this website is prohibited.
Please contact our PR department if you have any questions or need assistance at pr@teletrade.global.


