- Analytics
- News and Tools
- Market News
- USD/JPY Price Analysis: Rally inspired by continuation of BoJ’s ultra-dovish policy approaches 135.00
USD/JPY Price Analysis: Rally inspired by continuation of BoJ’s ultra-dovish policy approaches 135.00
- USD/JPY has jumped swiftly to near 135.00 as BoJ has announced a continuation of ultra-dovish monetary policy.
- The USD Index has jumped above 101.76 amid a delay in US debt-ceiling proposal and pre-Fed policy anxiety.
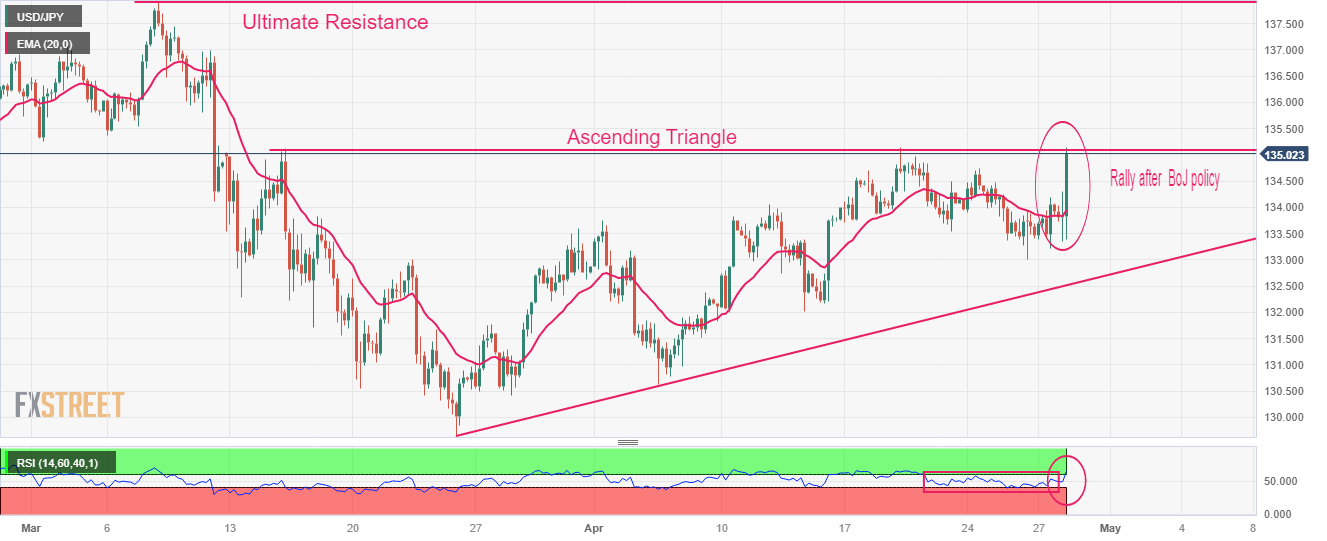
- USD/JPY is on the verge of delivering a breakout of the Ascending Triangle pattern.
The USD/JPY pair has scaled quickly to near the crucial resistance of 135.00 after the Bank of Japan (BoJ) announced a continuation of ultra-loose monetary policy and stability in Japanese Government Bonds’ (JGBs) yields band to maintain an expansionary policy stance. BoJ Governor Kazuo Ueda has confirmed that the central bank will take additional easing steps without hesitation as needed while striving for market stability.
S&P500 futures have recovered the majority of losses generated in the Asian session, portraying a recovery in appeal for US equities as investors are cheerful from solid quarterly performances by technology companies.
The US Dollar Index (DXY) has refreshed its day high at 101.76 amid a delay in US debt-ceiling proposal and pre-Federal Reserve (Fed) policy anxiety among the market participants.
On a four-hour scale, USD/JPY is near the edge of the horizontal resistance of the Ascending Triangle chart pattern plotted from March 15 high at 135.12. The upward-sloping trendline of the aforementioned chart pattern is placed from March 24 low at 129.64.
The 20-period Exponential Moving Average (EMA) below 134.00 has got highly diverged from the major, indicating solid strength in the upside bias.
Meanwhile, the Relative Strength Index (RSI) (14) has climbed above 60.00, which signals that the bullish momentum has been triggered.
Going forward, a decisive break above March 06 low at 135.37 will drive the major toward March 10 high at 137.00 followed by the ultimate resistance plotted from March 08 high at 137.91.
On the contrary, a break below April 05 low at 130.63 would drag the asset toward the round-level support of 130.00. A break below the 130.00 support would expose the asset to March 24 low at 129.64.
USD/JPY four-hour chart

© 2000-2026. All rights reserved.
This site is managed by Teletrade D.J. LLC 2351 LLC 2022 (Euro House, Richmond Hill Road, Kingstown, VC0100, St. Vincent and the Grenadines).
The information on this website is for informational purposes only and does not constitute any investment advice.
The company does not serve or provide services to customers who are residents of the US, Canada, Iran, The Democratic People's Republic of Korea, Yemen and FATF blacklisted countries.
Making transactions on financial markets with marginal financial instruments opens up wide possibilities and allows investors who are willing to take risks to earn high profits, carrying a potentially high risk of losses at the same time. Therefore you should responsibly approach the issue of choosing the appropriate investment strategy, taking the available resources into account, before starting trading.
Use of the information: full or partial use of materials from this website must always be referenced to TeleTrade as the source of information. Use of the materials on the Internet must be accompanied by a hyperlink to teletrade.org. Automatic import of materials and information from this website is prohibited.
Please contact our PR department if you have any questions or need assistance at pr@teletrade.global.


