- Analytics
- News and Tools
- Market News
- GBP/USD Price Analysis: Continuous failure of instability above 1.2500 makes Pound Sterling delicate
GBP/USD Price Analysis: Continuous failure of instability above 1.2500 makes Pound Sterling delicate
- GBP/USD has shown a corrective move after failing to sustain above 1.2500.
- A survey from Reuters showed that most shop chains do not foresee a lasting improvement in retail sales.
- The lack of upside momentum in the Pound Sterling makes it a fragile counter for market participants.
The GBP/USD pair has gradually corrected after failing to sustain above the psychological resistance of 1.2500 in the Asian session. The Cable has failed plenty of times in sustaining above the aforementioned resistance this month, making the Pound Sterling prone to further losses.
On Wednesday, investors dumped risk-sensitive assets and ran for the US Dollar Index (DXY) as a safe-haven after First Republic Bank cornered the US administration for not providing liquidity support. The USD Index showed a V-shape recovery after dropping to near the crucial support of 101.00.
Meanwhile, the Pound Sterling sensed selling pressure amid a slowdown in accelerating British retail sales. A survey from Reuters showed that most shop chains do not foresee a lasting improvement in retail sales. Also, expectations for May were slightly negative. This might provide some relief to Bank of England (BoE) policymakers.
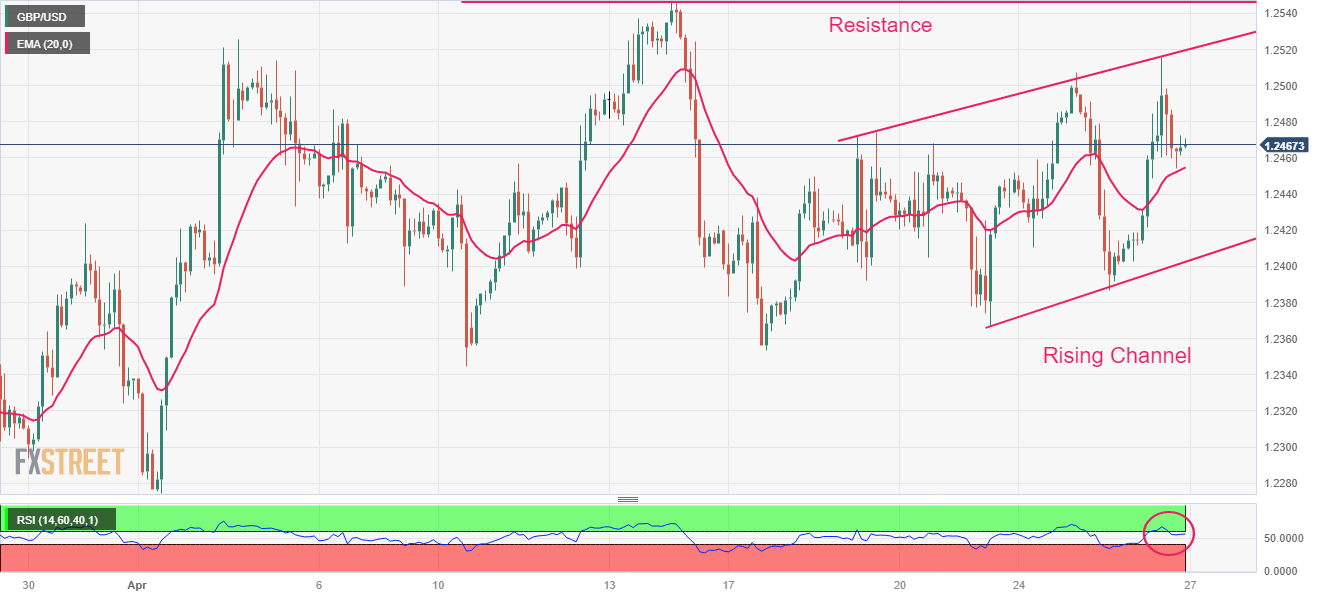
GBP/USD is auctioning in a Rising Channel chart pattern on a two-hour scale in which every pullback is considered a buying opportunity. It is worth noting that the lack of upside momentum in the Pound Sterling is making it a fragile counter for the market participants. The Cable is still above 20-period Exponential Moving Average (EMA) at 1.2468, indicating that the upside bias has not faded yet. Potential resistance is placed from April 14 high at 1.2545.
Meanwhile, the Relative Strength Index (RSI) (14) has slipped back into the 40.00-60.00 range, signaling a lack of momentum.
A decisive move above April 13 high at 1.2537 will drive the asset towards a fresh 10-month high at 1.2597, which is 08 June 2022 high. A breach of the latter will expose the asset to May 27 high at 1.2667.
On the flip side, a slippage below April 10 low at 1.2345 will expose the asset to March 30 low at 1.2294 followed by March 27 low at 1.2219.
GBP/USD daily chart
© 2000-2026. All rights reserved.
This site is managed by Teletrade D.J. LLC 2351 LLC 2022 (Euro House, Richmond Hill Road, Kingstown, VC0100, St. Vincent and the Grenadines).
The information on this website is for informational purposes only and does not constitute any investment advice.
The company does not serve or provide services to customers who are residents of the US, Canada, Iran, The Democratic People's Republic of Korea, Yemen and FATF blacklisted countries.
Making transactions on financial markets with marginal financial instruments opens up wide possibilities and allows investors who are willing to take risks to earn high profits, carrying a potentially high risk of losses at the same time. Therefore you should responsibly approach the issue of choosing the appropriate investment strategy, taking the available resources into account, before starting trading.
Use of the information: full or partial use of materials from this website must always be referenced to TeleTrade as the source of information. Use of the materials on the Internet must be accompanied by a hyperlink to teletrade.org. Automatic import of materials and information from this website is prohibited.
Please contact our PR department if you have any questions or need assistance at pr@teletrade.global.


