- Analytics
- News and Tools
- Market News
- Gold Price Forecast: XAU/USD gathers strength to capture $2,050 as US economy eyes recession
Gold Price Forecast: XAU/USD gathers strength to capture $2,050 as US economy eyes recession
- Gold price is aiming to capture the critical resistance of $2,050.00 as USD Index is eyeing more downside.
- Reduced borrowing by US banks from the Fed is advocating further slowdown in the US economy.
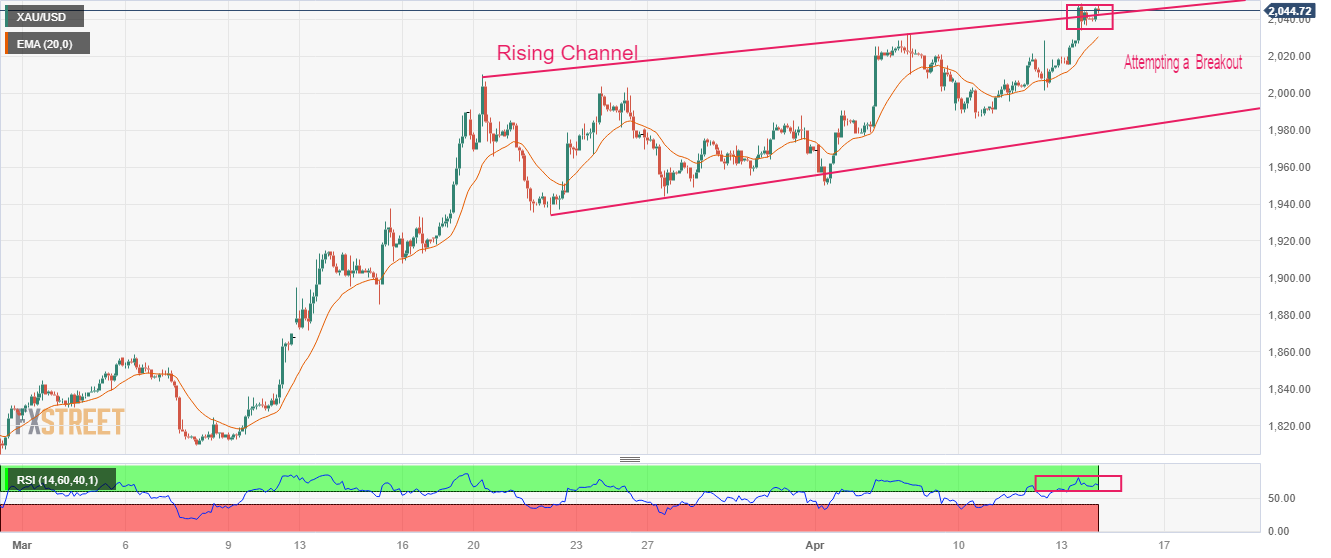
- Gold price is on the verge of delivering a breakout of the Rising Channel pattern.
Gold price (XAU/USD) is gathering strength to capture the critical resistance of $2,050.00 in the Asian session. The precious metal is looking to resume its upside journey after mild exhaustion in the upside momentum.
S&P500 futures are showing choppy moves in the Asian session after witnessing stellar buying on Thursday, portraying a risk appetite theme underpinned by the market participants. The US Dollar Index (DXY) has refreshed its 11-month low at 100.80 and is eyeing more weakness as investors are anticipating that the Federal Reserve (Fed) will look for pausing rate hikes after May monetary policy meeting.
Bloomberg reported that United States commercial banks reduced their borrowings from two Federal Reserve backstop lending facilities for a fourth straight week as liquidity constraints continue to ease following the collapse of Silicon Valley Bank last month. Lower credit disposal due to tight credit conditions could slow down the US economy, which might ease inflationary pressures sooner and force Fed chair Jerome Powell to wrap up the policy-tightening spell sooner.
On Friday, a power-pack action is expected from the USD Index amid the release of the US Retail Sales data. According to the consensus, the economic data will contract by 0.4%. The retail demand is likely to continue the pace of contraction as shown in February as US labor market conditions are cooling down.
Gold technical analysis
Gold price is auctioning in a Rising Channel chart pattern on a two-hour scale in which every pullback is capitalized for building fresh longs by the market participants. The yellow metal is consolidating near the breakout region of the aforementioned chart pattern.
Advancing 20-period Exponential Moving Average (EMA) at $2,031.00 is favoring more upside for Gold bulls.
The Relative Strength Index (RSI) (14) is oscillating in the bullish range of 60.00-80.00, indicating that the upside momentum is already active.
Gold two-hour chart

© 2000-2026. All rights reserved.
This site is managed by Teletrade D.J. LLC 2351 LLC 2022 (Euro House, Richmond Hill Road, Kingstown, VC0100, St. Vincent and the Grenadines).
The information on this website is for informational purposes only and does not constitute any investment advice.
The company does not serve or provide services to customers who are residents of the US, Canada, Iran, The Democratic People's Republic of Korea, Yemen and FATF blacklisted countries.
Making transactions on financial markets with marginal financial instruments opens up wide possibilities and allows investors who are willing to take risks to earn high profits, carrying a potentially high risk of losses at the same time. Therefore you should responsibly approach the issue of choosing the appropriate investment strategy, taking the available resources into account, before starting trading.
Use of the information: full or partial use of materials from this website must always be referenced to TeleTrade as the source of information. Use of the materials on the Internet must be accompanied by a hyperlink to teletrade.org. Automatic import of materials and information from this website is prohibited.
Please contact our PR department if you have any questions or need assistance at pr@teletrade.global.


