- Analytics
- News and Tools
- Market News
- Gold Price Forecast: XAU/USD eyes $2,000 as US-China tensions improve US Dollar’s appeal, US NFP in focus
Gold Price Forecast: XAU/USD eyes $2,000 as US-China tensions improve US Dollar’s appeal, US NFP in focus
- Gold price is likely to continue its downside move till $2,000.00 as US Dollar’s safe-haven appeal has improved.
- Slowing economic activities due to higher interest rates by the Fed are responsible for a recession in the US economy.
- Fed Mester advocates rates above 5% this year and holding them at restrictive levels for some time to quell inflation.
Gold price (XAU/USD) has dropped firmly to near $2,010.00 in the early European session. The precious metal is likely to attract more offers and may find a cushion near the psychological support of $2,000.00 ahead. The downside bias for the Gold price has stemmed from geopolitical tensions between the United States and China.
China seems uneasy about arms support to Taiwan from the United States. In retaliation, a Chinese Foreign Ministry spokesperson said China will take resolute and effective measures to safeguard national sovereignty, and territorial integrity. This has spooked the market sentiment and risk-sensitive assets have taken the bullet.
The US Dollar Index (DXY) is making efforts in keeping its business above 102.00. Meanwhile, the 10-year US Treasury yields have slipped below 3.3% again on expectations that the labor market is not extremely tight anymore.
Apart from the softening of the US labor market, the anticipation of a recession has strengthened further. Slowing economic activities due to higher interest rates by the Federal Reserve (Fed) are responsible for a recession in the US economy.
The street is expecting a neutral stance from Fed chair Jerome Powell for May’s monetary policy, however, Cleveland Fed Bank President Loretta Mester said policymakers should move their benchmark rate above 5% this year and hold it at restrictive levels for some time to quell inflation, as reported by Bloomberg.
Gold technical analysis
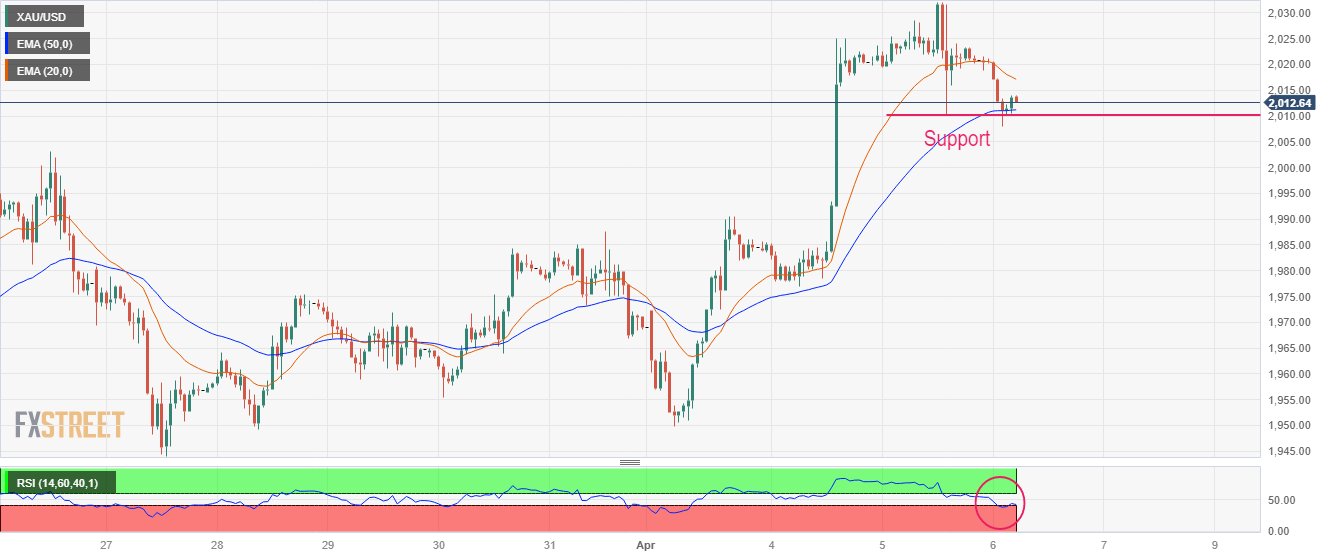
Gold price has challenged the immediate support plotted from Wednesday’s low at $2,010.88 on an hourly scale. The precious metal has slipped sharply below the 20-period Exponential Moving Average (EMA) at $2,017.18 while the 50-period EMA at $2,011.36 is providing cushion to the Gold bulls.
The Relative Strength Index (RSI) (14) has found support near 40.00. A case of a breakdown below the same would activate the bearish momentum.
Gold hourly chart

© 2000-2026. All rights reserved.
This site is managed by Teletrade D.J. LLC 2351 LLC 2022 (Euro House, Richmond Hill Road, Kingstown, VC0100, St. Vincent and the Grenadines).
The information on this website is for informational purposes only and does not constitute any investment advice.
The company does not serve or provide services to customers who are residents of the US, Canada, Iran, The Democratic People's Republic of Korea, Yemen and FATF blacklisted countries.
Making transactions on financial markets with marginal financial instruments opens up wide possibilities and allows investors who are willing to take risks to earn high profits, carrying a potentially high risk of losses at the same time. Therefore you should responsibly approach the issue of choosing the appropriate investment strategy, taking the available resources into account, before starting trading.
Use of the information: full or partial use of materials from this website must always be referenced to TeleTrade as the source of information. Use of the materials on the Internet must be accompanied by a hyperlink to teletrade.org. Automatic import of materials and information from this website is prohibited.
Please contact our PR department if you have any questions or need assistance at pr@teletrade.global.


