- Analytics
- News and Tools
- Market News
- Gold and Silver prices consolidate ahead of high-stakes events on Friday
Gold and Silver prices consolidate ahead of high-stakes events on Friday
- Precious metals have stabilized after big rallies in March.
- Gold price needs fresh impulse from US PCE inflation, Chinese PMIs before bulls target higher levels.
- Silver price trend has been slower but more constant, bulls target $24.50.
Precious metals are consolidating this week after seeing enormous gains since the beginning of March. Gold price (XAU/USD) is trading comfortably above $1,950 after having peaked around the thick $2,000 round resistance. Meanwhile, Silver price (XAG/USD) has seen a constant uptrend with fewer ups-and-downs and is trading above $23, still with room to cover before reaching the year-to-date highs of early January around $24.50.
Gold price trading choppy as it awaits US PCE inflation, Chinese PMIs
Gold trading has been choppy for most of the week as the volatility seen in the past two weeks, with banking bankruptcies and high-stakes central bank meetings getting all the attention, fades.
The market is now looking ahead to the next Federal Reserve (Fed) meeting in early May, and will spend April trying to figure out the likelihood of more interest rate hikes to combat relentless inflation before the inevitable easing of the monetary policy by the US central bank starts. The next top-tier event to start figuring that out is the US Personal Consumption Expenditures (PCE) Price Index release on Friday, the Fed’s preferred measure of inflation. Friday should be a high-stakes trading day, featuring also the Chinese Purchasing Managers Index (PMI) releases – China is the biggest Gold market in the world – and end-of-quarter trading flows.
Until then, Gold price is likely to stay rangebound, together with stable US Treasury bond yields and US Dollar Index value.
Silver price on a solid uptrend
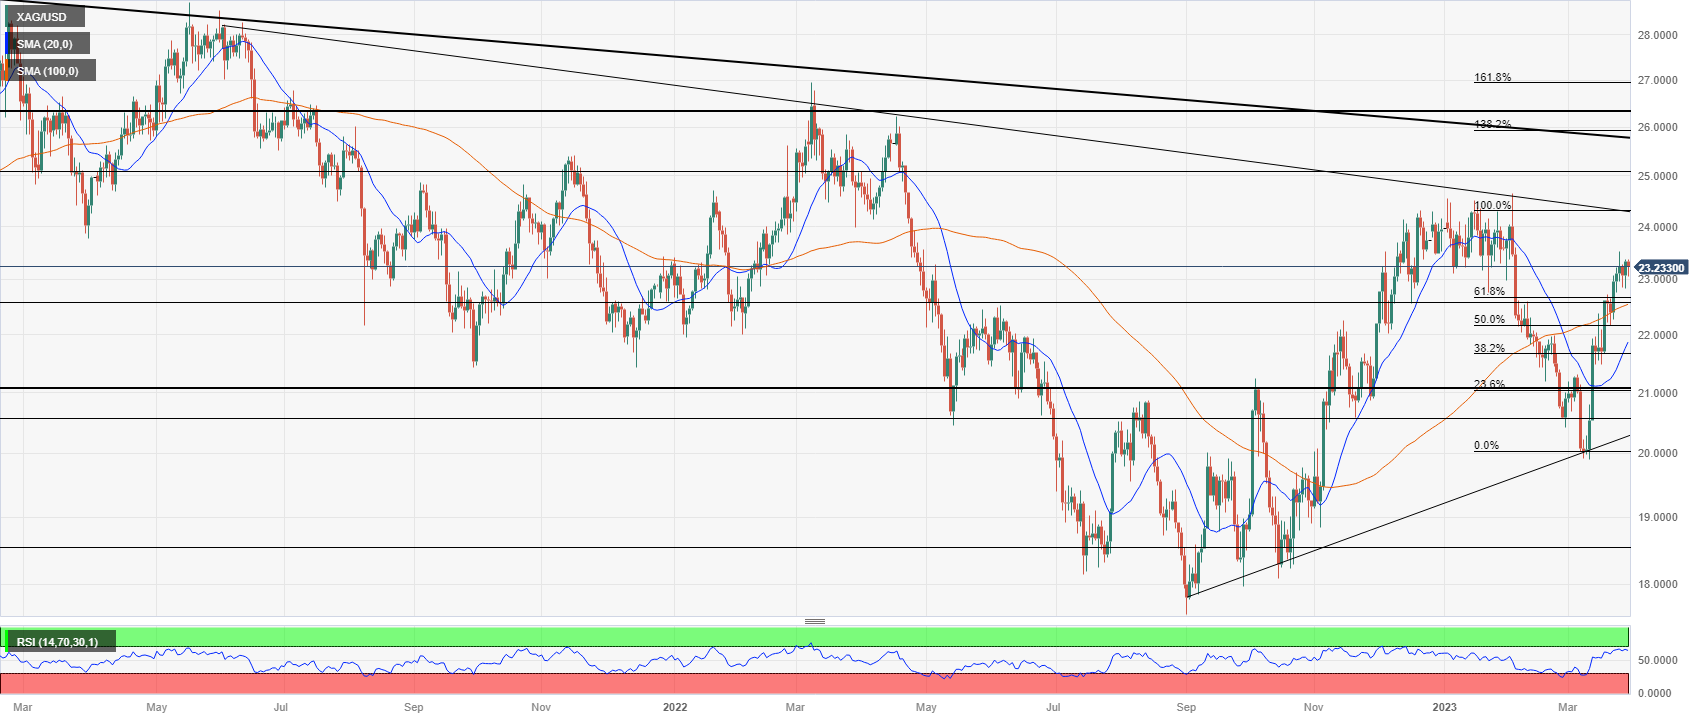
The second most precious metal, Silver, is highly correlated with Gold, as usual. That said, XAG/USD has not seen as much of a retracement this week, actually making its higher daily close since early February on Wednesday, around $23.30.
Silver had seen a much more profound sell-off during the market turnaround seen in February due to the expected Fed hawkishness. Since the course of financial markets swang again after the collapse of Silicon Valley Bank (SVB), Silver price had more room to recover but has done so with a relentless uptrend, barely noticing any retracements.
XAG/USD has already rallied past the 61.8% Fibonacci retracement level from the January 16-March 8 downtrend, and with its main Simple Moving Averages (20 and 100) in the daily chart nearing a bullish cross, it could soon find a platform for another rally back to year-to-date highs. These levels, around $24,50, are the main target and resistance for Silver bulls, as they coincide with a long-term bearish trendline that has contained price action since May 2021.
The fact that Silver price has managed to stay outside overbought territory helps the continuation of a slow but solid uptrend to these levels if fundamentals remain in favor of precious metals, with Federal Reserve interest rate expectations somewhat limited.

Silver price (XAG/USD) daily chart
© 2000-2026. All rights reserved.
This site is managed by Teletrade D.J. LLC 2351 LLC 2022 (Euro House, Richmond Hill Road, Kingstown, VC0100, St. Vincent and the Grenadines).
The information on this website is for informational purposes only and does not constitute any investment advice.
The company does not serve or provide services to customers who are residents of the US, Canada, Iran, The Democratic People's Republic of Korea, Yemen and FATF blacklisted countries.
Making transactions on financial markets with marginal financial instruments opens up wide possibilities and allows investors who are willing to take risks to earn high profits, carrying a potentially high risk of losses at the same time. Therefore you should responsibly approach the issue of choosing the appropriate investment strategy, taking the available resources into account, before starting trading.
Use of the information: full or partial use of materials from this website must always be referenced to TeleTrade as the source of information. Use of the materials on the Internet must be accompanied by a hyperlink to teletrade.org. Automatic import of materials and information from this website is prohibited.
Please contact our PR department if you have any questions or need assistance at pr@teletrade.global.


