- Analytics
- News and Tools
- Market News
- Gold Price Forecast: XAU/USD grinds near $1,925 hurdle amid sluggish yields – Confluence Detector
Gold Price Forecast: XAU/USD grinds near $1,925 hurdle amid sluggish yields – Confluence Detector
- Gold price struggles to extend previous day’s run-up six-week high, mildly offered as of late.
- Key resistance confluence, receding fears of full-fledged financial market crisis probe XAU/USD bulls.
- Credit Suisse joins the league of SVB, Signature Bank to previously propel Gold price.
- Second-tier data, bond market moves eyed for clear directions.
Gold price (XAU/USD) fades upside momentum despite recently bouncing off intraday low to $1,908 during early Thursday. In doing so, the precious metal justifies the previous day’s failure to cross the $1,923 key hurdle while also taking clues from the market’s indecision amid looming fears of financial market distress.
A European G-SIB – a global systemically important bank, namely Credit Suisse, rocked finance markets the previous day, joining the line of Silicon Valley Bank (SVB) and Signature Bank from the US. However, the global policymakers’ rush to placate the market fears, recently by the Saudi National Bank, seems to prod the XAU/USD’s haven demand. Also weighing on the Gold price could be the lackluster Treasury yields as bond traders lick their wounds after refreshing the multi-day low the previous day. Furthermore, intact hawkish hopes from the US Federal Reserve (Fed) and the European Central (ECB) also challenge the commodity buyers ahead of a likely another volatile day.
Also read: Gold Price Forecast: XAU/USD’s struggle with $1,919 extends amid banking crisis, ahead of ECB decision
Gold Price: Key levels to watch
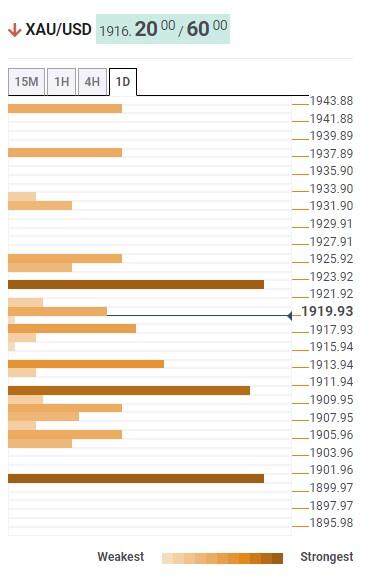
As per the Technical Confluence Detector, the Gold price reversed from the $1,924 resistance confluence including Pivot Point one-month R1.
The XAU/USD pullback, however, remains elusive as the quote stays beyond the short-term key support surrounding $1,910, comprising Pivot Point one-week R2 and SMA10 on Four-hour.
It should be observed that Fibonacci 38.2% on one-day restricts the immediate downside of the Gold price near $1,917.
That said, the Gold price weakness past $1,910 could quickly drag it to the key $1,901-1900 support confluence encompassing Fibonacci 61.8% on one-month.
On the flip side, a clear upside break of $1,924 hurdle may need validation from the $1,925 mark comprising Fibonacci 23.6% on one-day before fueling Gold price towards the previous daily high surrounding $1,938.
In a case where XAU/USD remains firmer past $1,938, it can prod the $1,945 resistance mark signified by the Pivot Point one-day R1.
Here is how it looks on the tool

About Technical Confluences Detector
The TCD (Technical Confluences Detector) is a tool to locate and point out those price levels where there is a congestion of indicators, moving averages, Fibonacci levels, Pivot Points, etc. If you are a short-term trader, you will find entry points for counter-trend strategies and hunt a few points at a time. If you are a medium-to-long-term trader, this tool will allow you to know in advance the price levels where a medium-to-long-term trend may stop and rest, where to unwind positions, or where to increase your position size.
© 2000-2026. All rights reserved.
This site is managed by Teletrade D.J. LLC 2351 LLC 2022 (Euro House, Richmond Hill Road, Kingstown, VC0100, St. Vincent and the Grenadines).
The information on this website is for informational purposes only and does not constitute any investment advice.
The company does not serve or provide services to customers who are residents of the US, Canada, Iran, The Democratic People's Republic of Korea, Yemen and FATF blacklisted countries.
Making transactions on financial markets with marginal financial instruments opens up wide possibilities and allows investors who are willing to take risks to earn high profits, carrying a potentially high risk of losses at the same time. Therefore you should responsibly approach the issue of choosing the appropriate investment strategy, taking the available resources into account, before starting trading.
Use of the information: full or partial use of materials from this website must always be referenced to TeleTrade as the source of information. Use of the materials on the Internet must be accompanied by a hyperlink to teletrade.org. Automatic import of materials and information from this website is prohibited.
Please contact our PR department if you have any questions or need assistance at pr@teletrade.global.


