- Analytics
- News and Tools
- Market News
- Gold Price Forecast: XAU/USD continues to juggle above $1,900 despite US Inflation softens
Gold Price Forecast: XAU/USD continues to juggle above $1,900 despite US Inflation softens
- Gold price is struggling to come out of the woods despite the continuation of declining US Inflation.
- The USD Index is defending the critical support of 103.50 but looks prone to the further downside amid the risk-on mood.
- Monthly US Retail Sales data is expected to contract by 0.3% vs. the former release of 3% expansion.
Gold price (XAU/USD) is inside the woods despite the United States inflation figures meeting expectations. The precious metal is continuously oscillating in a narrow range of $1,895-1,913 from Monday. The release of the US Consumer Price Index (CPI) failed to deliver a power-pack action in the Gold price, however, the upside bias looks solidified as bets for smaller rate hikes from the Federal Reserve (Fed) have soared.
The US Dollar Index (DXY) is defending the critical support of 103.50 but looks prone to the further downside as investors’ risk appetite has improved dramatically. S&P500 futures witnessed responsive buying from the market participants as higher odds of a smaller rate hike from Fed chair Jerome Powell might postpone a likely recession in the US economy, portraying a sheer recovery in overall optimism.
Contrary to the risk-on mood, the demand for US Treasury bonds remained vulnerable, which led the 10-year US Treasury yields higher above 3.68%.
The headline US CPI was expanded by 0.4% on a monthly basis, as expected and the annual figure softened to 6.0% from the former release of 6.4%. And, the core CPI that excludes oil and food prices dropped marginally to 5.5% from the former release of 5.6%. The continuation of a declining trend in the US inflation seems delightful for the Fed.
Going forward, investors will keep an eye on the US Retail Sales (Feb) data. Monthly Retail Sales data is expected to contract by 0.3% vs. the former release of 3% expansion. This indicates that resilience in consumer spending is over and the Fed is on track of achieving the 2% inflation target.
Gold technical analysis
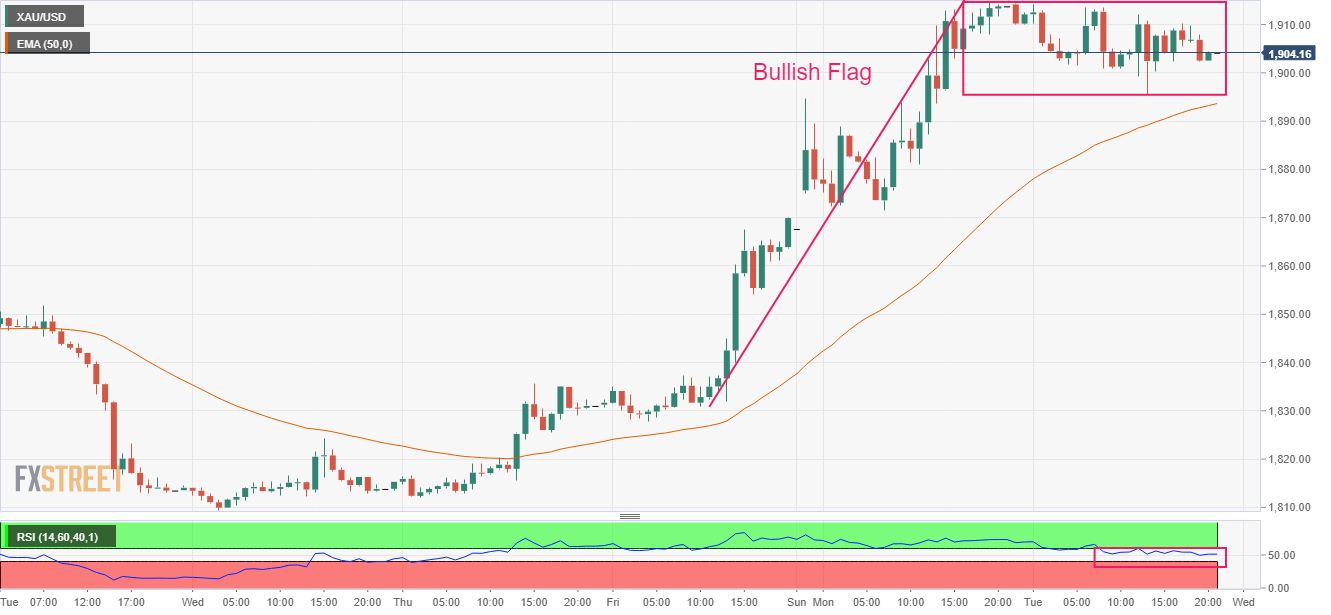
Gold price is forming a Bullish Flag chart pattern on an hourly scale, which indicates a continuation of the bullish momentum after the breakout of a consolidation. Usually, the consolidation phase of the chart pattern serves as an inventory adjustment in which those participants initiate longs, which prefer to enter an auction after the establishment of a bullish bias.
Advancing 50-period Exponential Moving Average (EMA) at $1,894.00 add to the upside filters.
The Relative Strength Index (RSI) (14) is oscillating in a bullish range of 40.00-60.00. A break into the bullish range of 60.00-80.00 will trigger the upside momentum.
Gold hourly chart

© 2000-2026. All rights reserved.
This site is managed by Teletrade D.J. LLC 2351 LLC 2022 (Euro House, Richmond Hill Road, Kingstown, VC0100, St. Vincent and the Grenadines).
The information on this website is for informational purposes only and does not constitute any investment advice.
The company does not serve or provide services to customers who are residents of the US, Canada, Iran, The Democratic People's Republic of Korea, Yemen and FATF blacklisted countries.
Making transactions on financial markets with marginal financial instruments opens up wide possibilities and allows investors who are willing to take risks to earn high profits, carrying a potentially high risk of losses at the same time. Therefore you should responsibly approach the issue of choosing the appropriate investment strategy, taking the available resources into account, before starting trading.
Use of the information: full or partial use of materials from this website must always be referenced to TeleTrade as the source of information. Use of the materials on the Internet must be accompanied by a hyperlink to teletrade.org. Automatic import of materials and information from this website is prohibited.
Please contact our PR department if you have any questions or need assistance at pr@teletrade.global.


