- Analytics
- News and Tools
- Market News
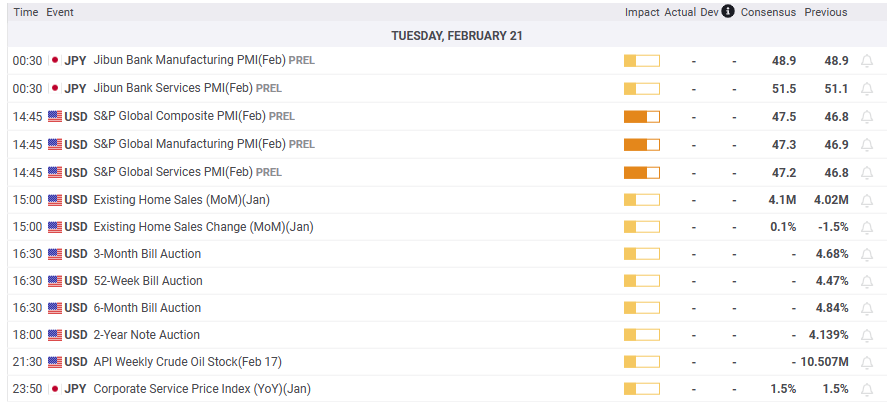
- USD/JPY hovers around 134.30s as traders eye Japanese and US PMIs, US housing data
USD/JPY hovers around 134.30s as traders eye Japanese and US PMIs, US housing data
- USD/JPY is still underpinned by the US 10-year Treasury bond yield and the market mood.
- The latest US inflation data triggered the last week’s USD/JPY rally from 131.50 to 135.00.
- USD/JPY Technical analysis: To remain consolidated, slightly tilted upwards.
The USD/JPY fluctuated in Monday’s session as US financial markets remained closed during President’s Day. US equity futures are negative, except for the Dow Jones Industrial Average. The US Dollar continued to trend lower, while US Treasury bond yields capped the USD/JPY fall. The USD/JPY is trading at 134.23, above its opening price by 0.07%.
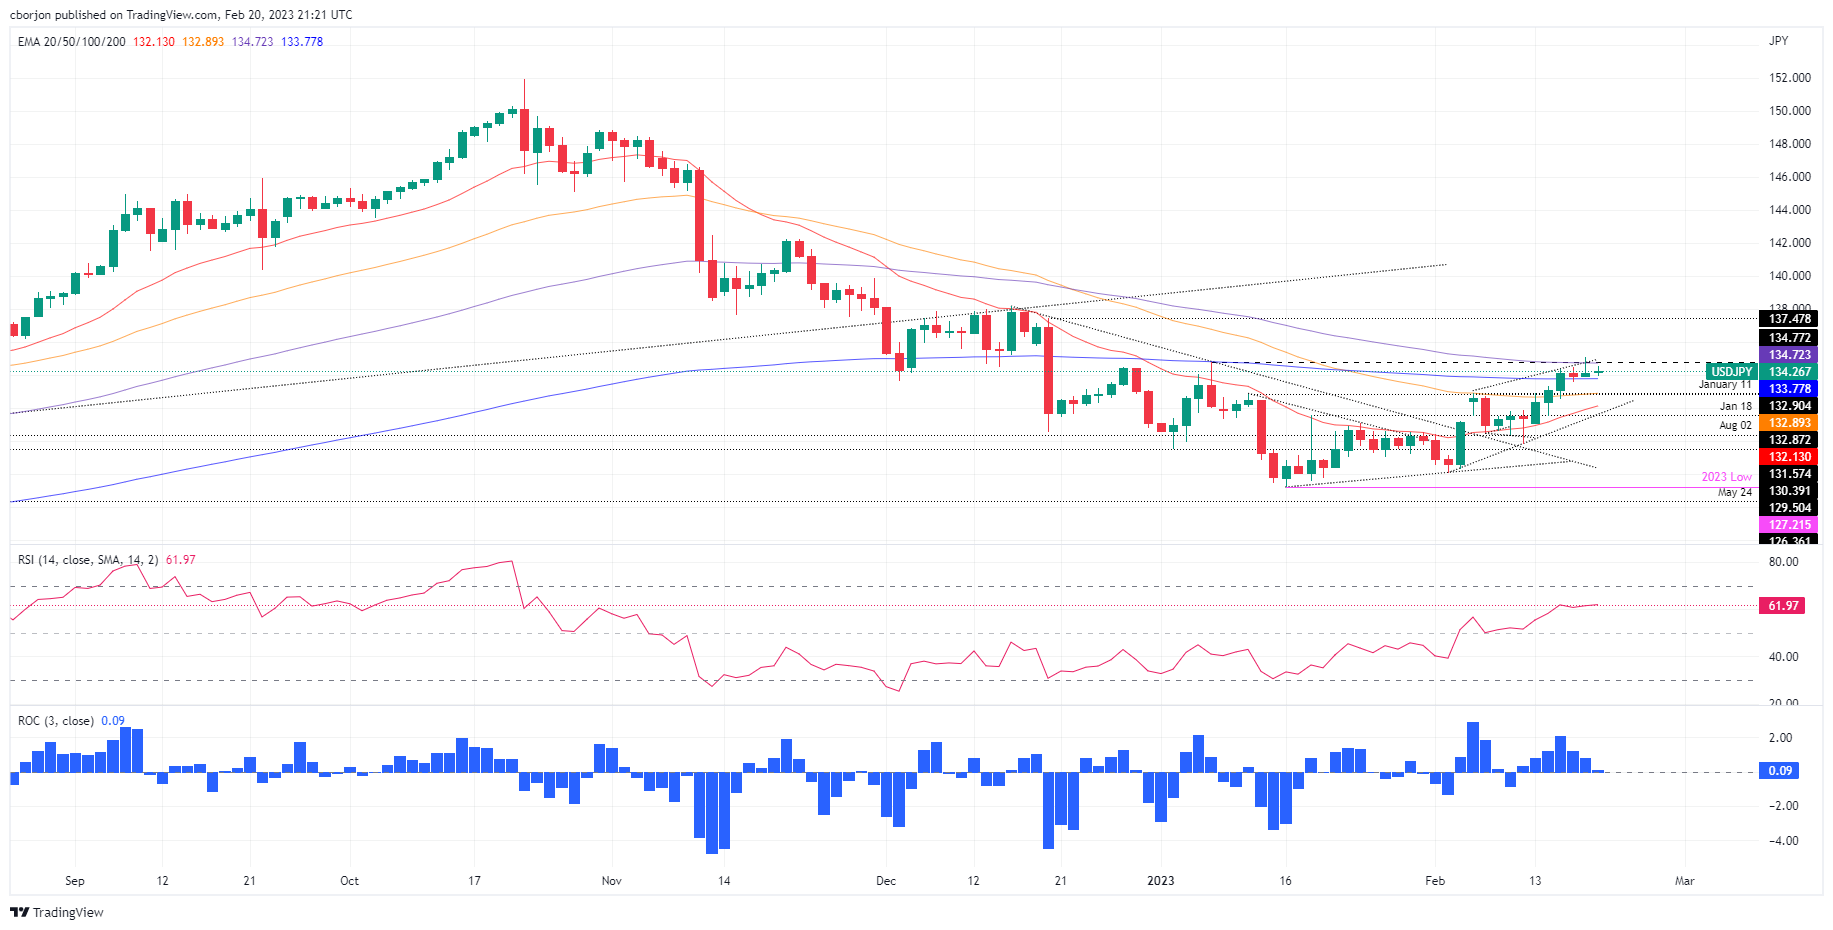
After reclaiming the 50-day Exponential Moving Average (EMA) at 132.73, the USD/JPY enjoyed a rally that peaked at around 135.11. Bull’s failure to hold gains above the latter exacerbated a fall to the 134.20s area, mainly driven by the fall in the US 10-year benchmark note rate, which finished last Friday’s session on a lower note.
Last week’s US inflation data in the consumer segment showed some slowing down. Prices paid by producers, also known as PPI, rose above estimates and the previous month’s reading on a monthly basis. Therefore, traders shifted from a risk-on to a risk-off environment, as traders expect a more hawkish than estimated US Federal Reserve (Fed).
In the meantime, changes in the Bank of Japan (BoJ) are increasing volatility in the pair. Given that Kazuo Ueda remains the leader to become the new BoJ Governor, investors are positioning toward a more hawkish BoJ stance. On early Monday in the Asian session, the current BoJ Deputy Governor Amamiya said that the BoJ has the necessary tools to exit from ultra-loose monetary conditions.
What to watch?

USD/JPY Technical analysis
The USD/JPY uptrend lost steam as it formed an inverted hammer near the peak at around 135.00. Buyers’ failure to hold to the latter exacerbated a retracement below the 100-day EMA at 134.72, opening the door to consolidate within the important 200-day EMA at 133.77 and 134.70, a 100 pip range. The Relative Strength Index (RSI) shifted falt though at bullish territory, signals that buyers are taking a respite, while the Rate of Change (RoC), is almost unchanged. Break above the 100-day EMA, and the USD/JPY might re-test 135.00. On the downside, a break below 134.00 would challenge the 200-day EMA.

© 2000-2026. All rights reserved.
This site is managed by Teletrade D.J. LLC 2351 LLC 2022 (Euro House, Richmond Hill Road, Kingstown, VC0100, St. Vincent and the Grenadines).
The information on this website is for informational purposes only and does not constitute any investment advice.
The company does not serve or provide services to customers who are residents of the US, Canada, Iran, The Democratic People's Republic of Korea, Yemen and FATF blacklisted countries.
Making transactions on financial markets with marginal financial instruments opens up wide possibilities and allows investors who are willing to take risks to earn high profits, carrying a potentially high risk of losses at the same time. Therefore you should responsibly approach the issue of choosing the appropriate investment strategy, taking the available resources into account, before starting trading.
Use of the information: full or partial use of materials from this website must always be referenced to TeleTrade as the source of information. Use of the materials on the Internet must be accompanied by a hyperlink to teletrade.org. Automatic import of materials and information from this website is prohibited.
Please contact our PR department if you have any questions or need assistance at pr@teletrade.global.


