- Analytics
- News and Tools
- Market News
- WTI Price Analysis: Bulls pile it on in $75.00 target area, focus is on Asian highs guarding $77.70
WTI Price Analysis: Bulls pile it on in $75.00 target area, focus is on Asian highs guarding $77.70
- WTI dropped to the %75s and now the daily chart shows the price breaking the trendline support.
- WTI, however, is now correcting higher to $76.70 resistance.
- The $77.70s are eyed as a 61.8% ratio target.
As per the prior analysis of the week, targetting the $75s target area, the objective was reached in the New york equities cash opening window with heightened volatility. The focus is now on the upside as the bulls move in for the kill to sweep the buy liquidity with a focus on the Asian highs that guard the price imbalances above. Targets are placed around $77.50 (50% mean reversion area), $77.70 (Mondayinitial balance lows) and a 61.8% Fibonacci retracement of the latest bearish impulse around $78.80 as the following analysis illustrates.
WTI, prior analysis
WTI bears taking control into the Fed, eyes on $75.00bbl
WTI Price Analysis: Bears break key hourly structure, eye $75.00bbls
It was suggested that ''a correction into resistance could entice trapped longs to get out of losing or breakeven positions and subsequently the shorts coming onto the market around 38.2% Fibonacci correction could see a move out of the consolidation below the trapped volume and into a 100% measured target towards $75.00 over the course of the coming week.''
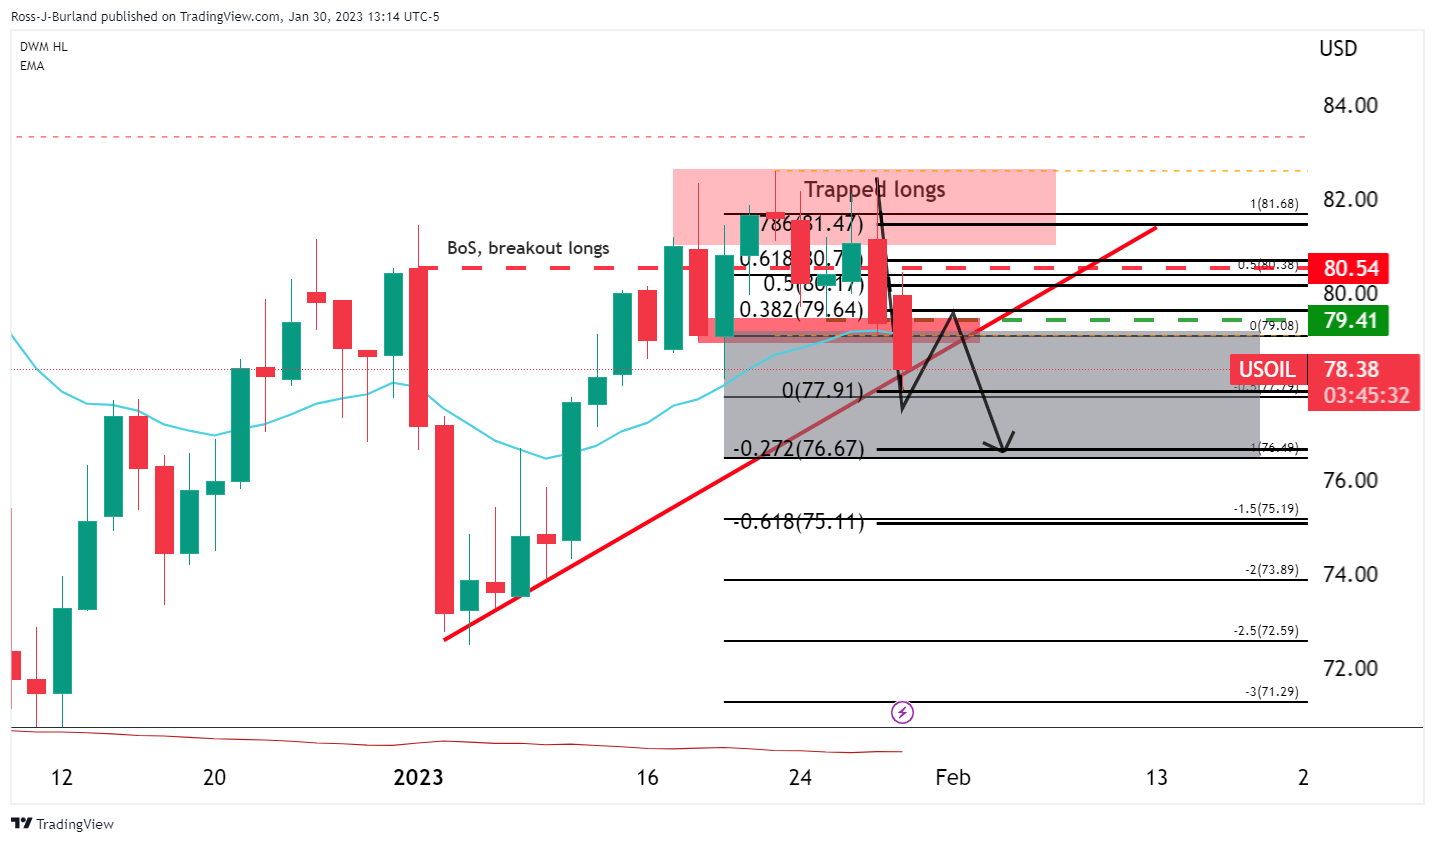
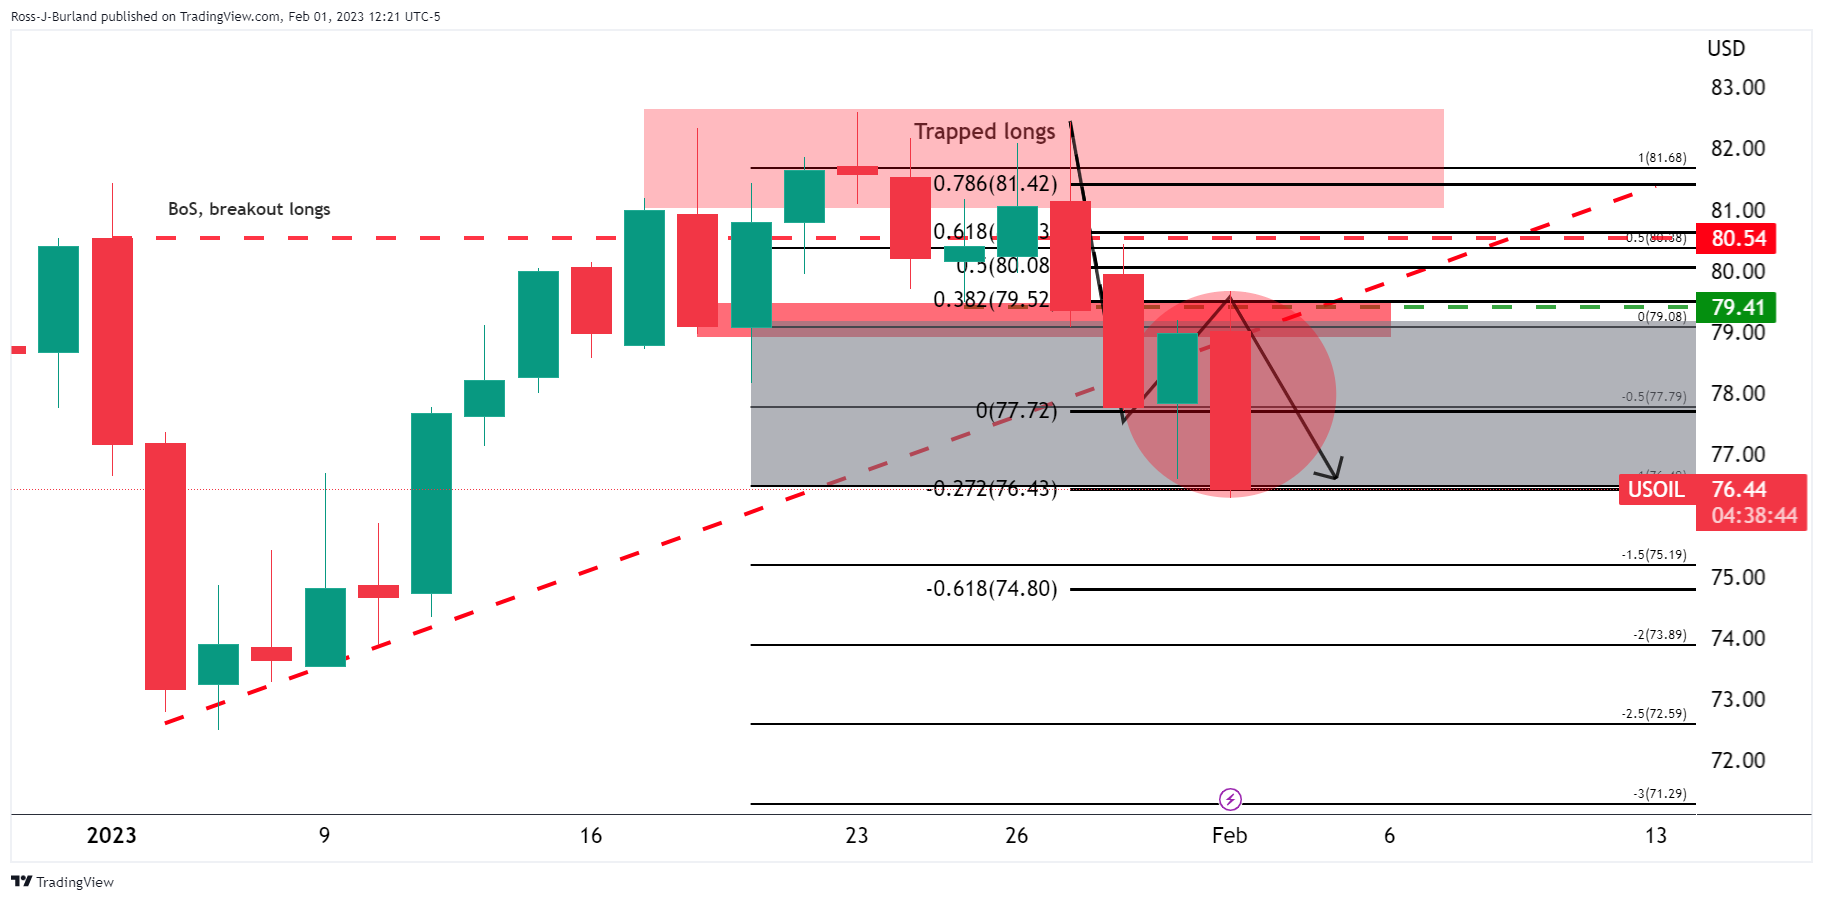
As illustrated, the price sank into the target area following a correction into where shorts were looking to get in at a premium. The subsequent move had fulfilled the 100% measured move and $75.00 was beckoning:
WTI H1 charts, prior analysis
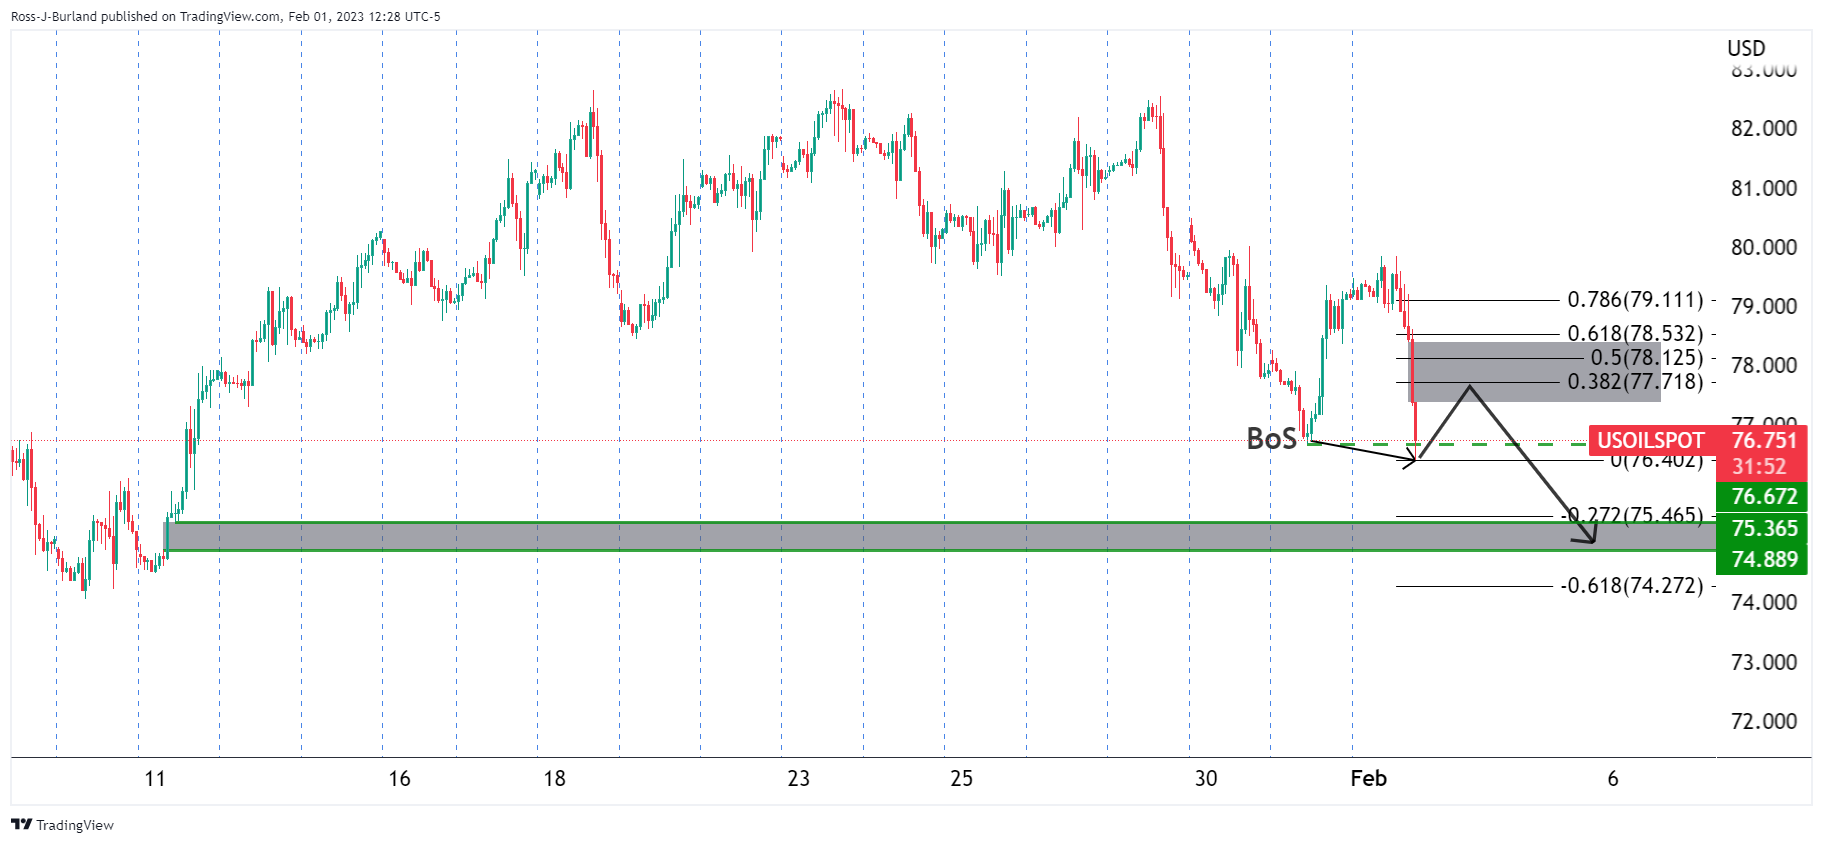
Zoomed in ...
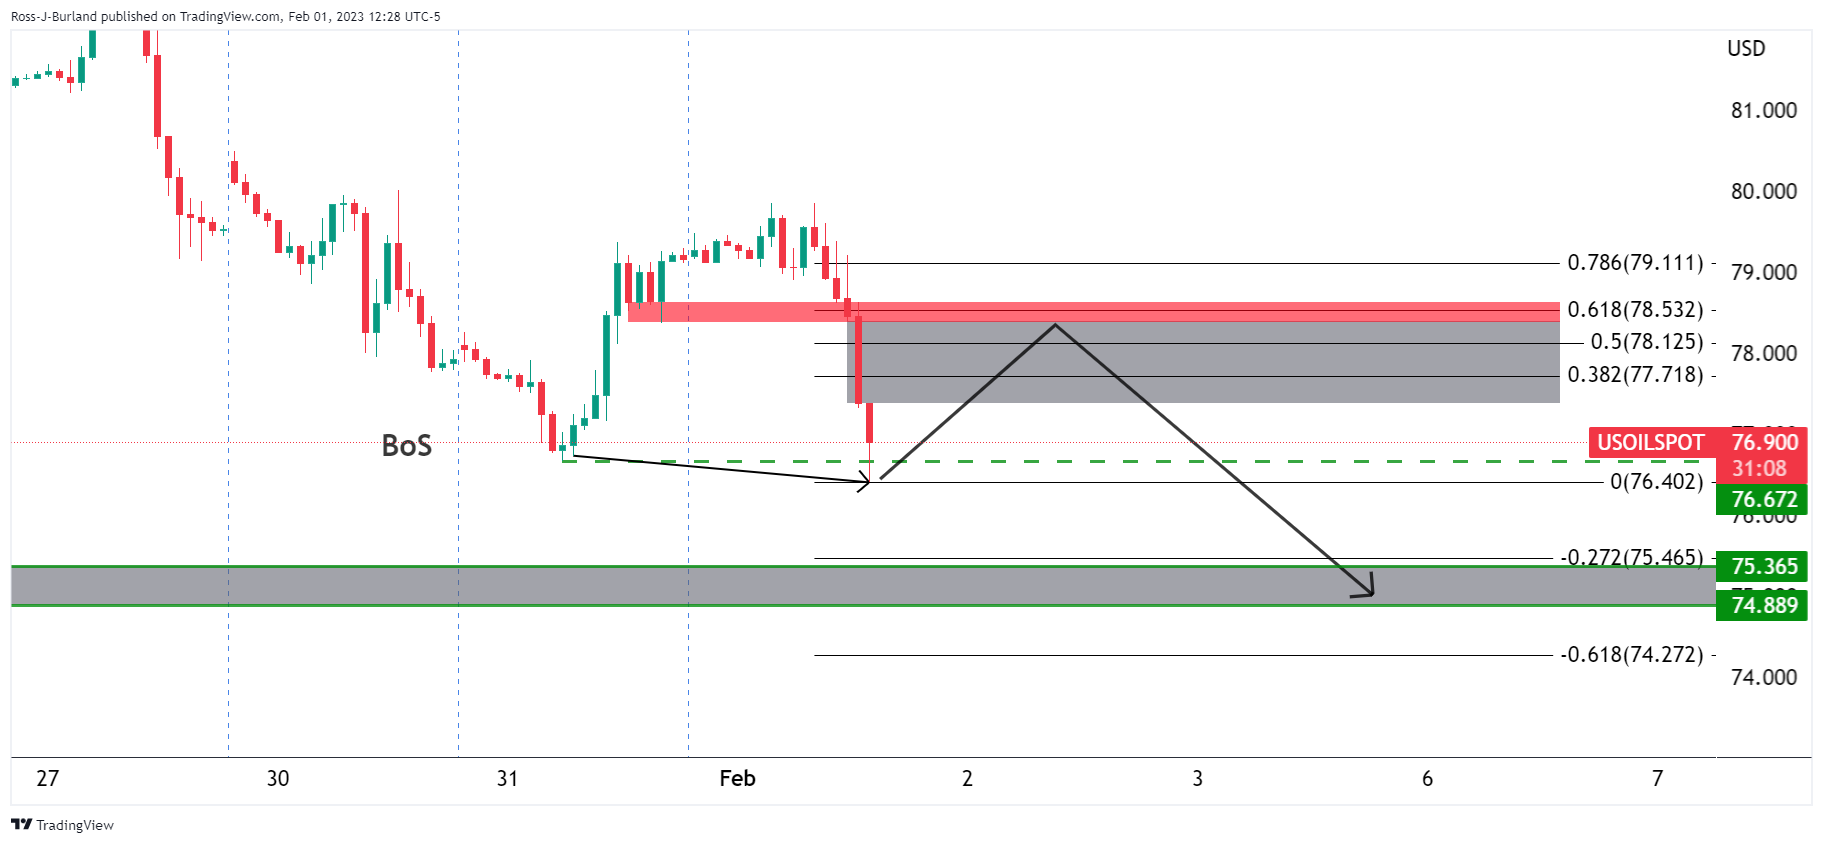
The greyed areas were price imbalances while the red marking was a resistance zone that had a confluence with the 61.8% Fibonacci retracement level near $78.50. While below there, the bias was to the downside.
However, a more shallow correction may be all that was needed. Either way, bears were looking to target between $75.36 and $74.88 on a break of $75.50.
WTI Update
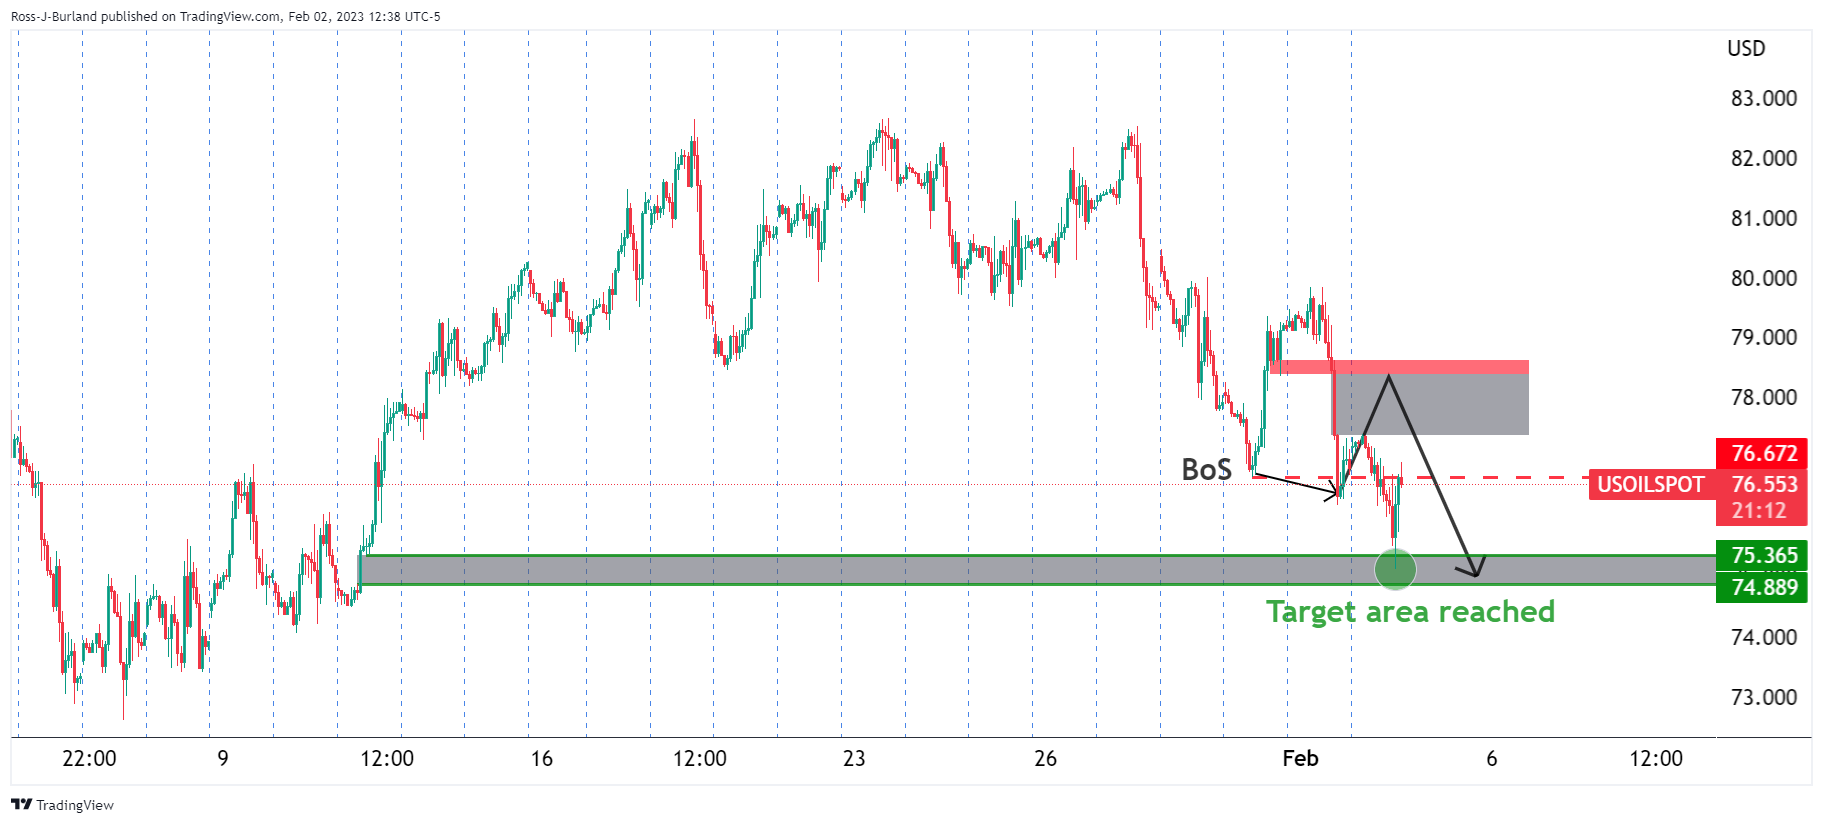
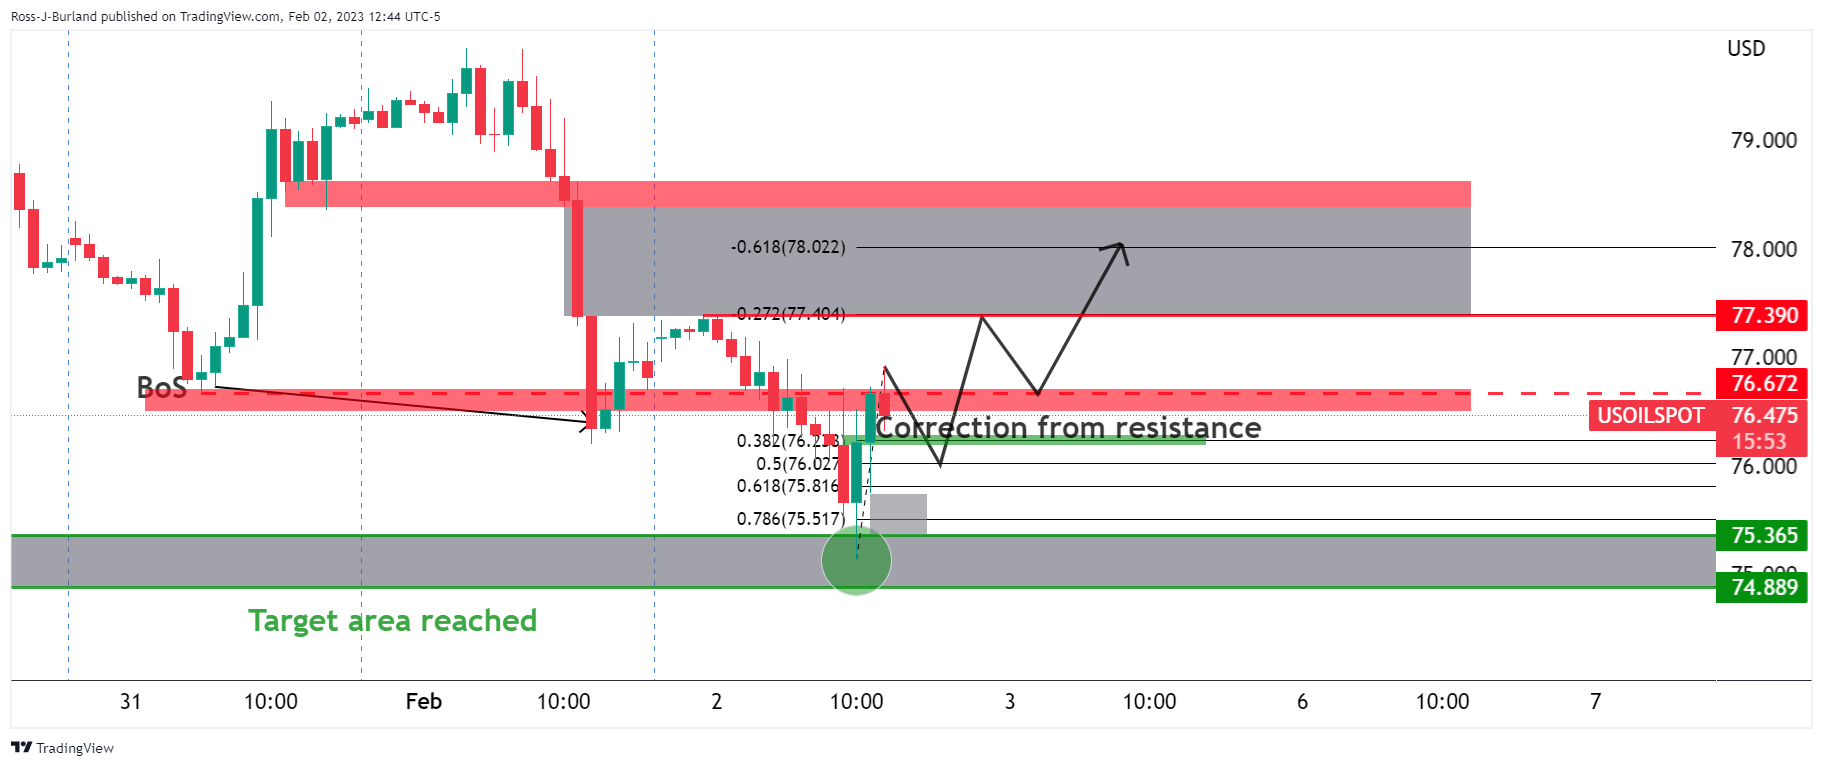
The price has reached the resistance and a correction is underway.
WTI daily and M15 charts
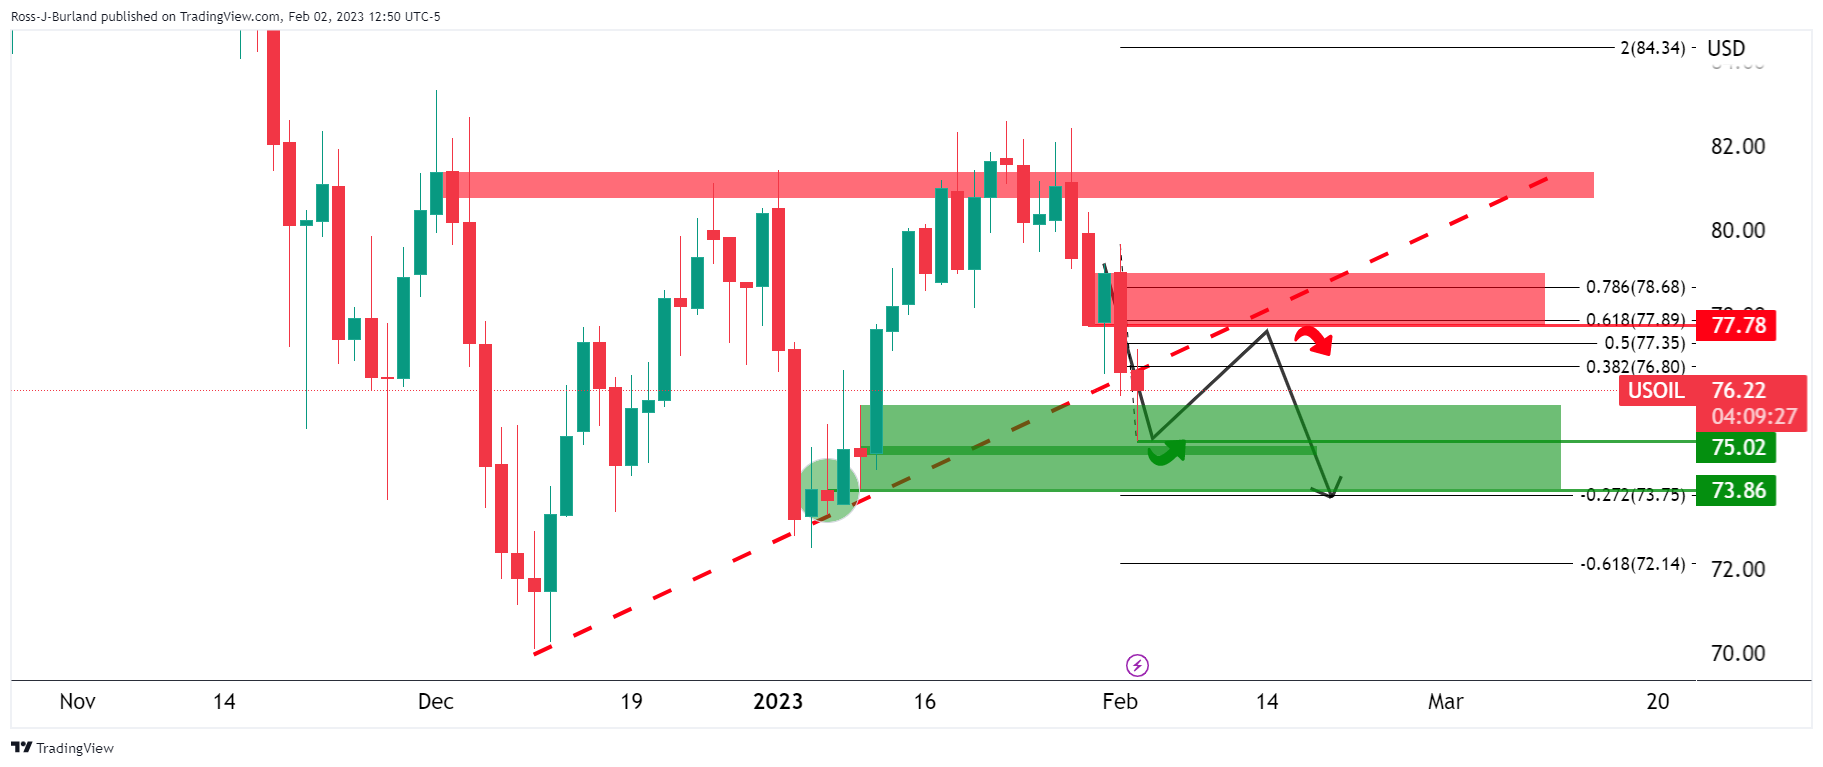
The daily chart shows the price breaking the trendline support but meeting horizontal support and correcting. If this is the start of a daily correction, then the $77.70s are eyed in a 61.8% ratio of the bearish impulse.
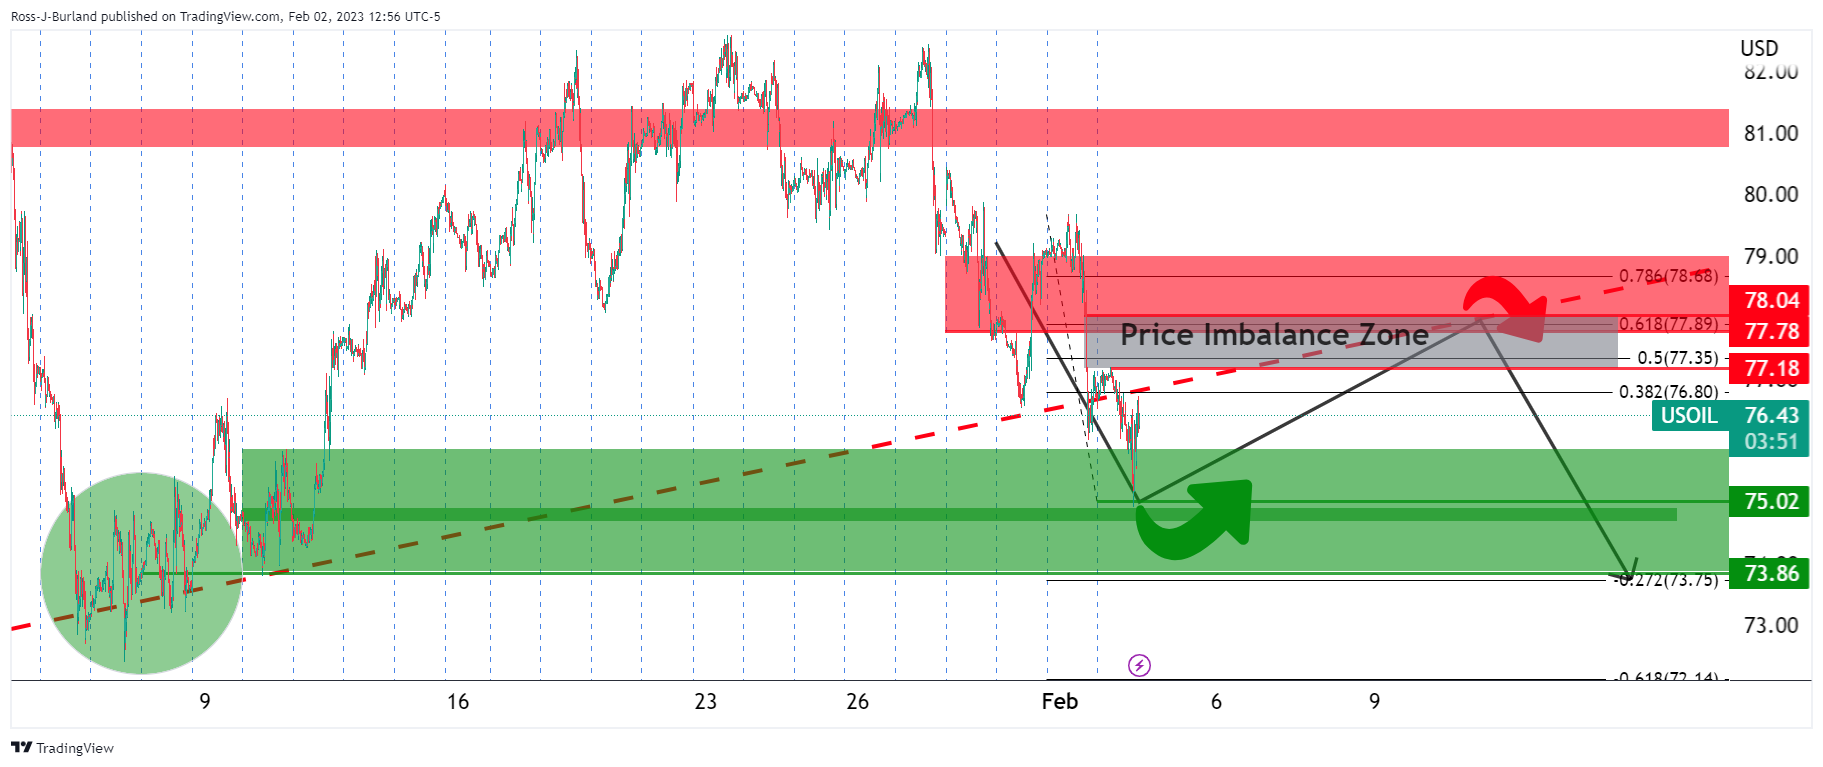
Moving down to the 15-minute chart we can see a price imbalance between $77.18 and $78.04 for the bulls to target:
© 2000-2026. All rights reserved.
This site is managed by Teletrade D.J. LLC 2351 LLC 2022 (Euro House, Richmond Hill Road, Kingstown, VC0100, St. Vincent and the Grenadines).
The information on this website is for informational purposes only and does not constitute any investment advice.
The company does not serve or provide services to customers who are residents of the US, Canada, Iran, The Democratic People's Republic of Korea, Yemen and FATF blacklisted countries.
Making transactions on financial markets with marginal financial instruments opens up wide possibilities and allows investors who are willing to take risks to earn high profits, carrying a potentially high risk of losses at the same time. Therefore you should responsibly approach the issue of choosing the appropriate investment strategy, taking the available resources into account, before starting trading.
Use of the information: full or partial use of materials from this website must always be referenced to TeleTrade as the source of information. Use of the materials on the Internet must be accompanied by a hyperlink to teletrade.org. Automatic import of materials and information from this website is prohibited.
Please contact our PR department if you have any questions or need assistance at pr@teletrade.global.


