- Analytics
- News and Tools
- Market News
- Gold Price Forecast: XAU/USD juggles above $1,950 as risk-on mood loses momentum ahead of US NFP
Gold Price Forecast: XAU/USD juggles above $1,950 as risk-on mood loses momentum ahead of US NFP
- Gold price is facing barricades in extending range towards the north as USD Index is attempting a cushion around 100.50.
- Analysts at the National Bank of Canada anticipate a policy change by the FOMC in the first quarter of 2023.
- Going forward, the US NFP data will be of utmost importance.
Gold price (XAU/USD) is displaying back-and-forth moves in the early London session after a breathtaking rally above the crucial resistance of $1,950.00. The precious metal has turned sideways as the US Dollar Index (DXY) is building a cushion around 100.50. The upside bias is still favored as a smaller interest rate hike by the Federal Reserve (Fed) has pushed the USD Index into a negative trajectory.
Economists at the National Bank of Canada believe “It would be a mistake for the Fed to persist in raising its key rate well beyond the current level and holding it there for an extended period if inflation continues to surprise on the downside.” Therefore a policy change from the FOMC in the first quarter of 2023 is anticipated, which would set the stage for a more prolonged decline.
Meanwhile, S&P500 futures are holding their morning gains confidently, portraying that the risk appetite theme is extremely solid. However, the 10-year US Treasury yields have scaled firmly above 3.42%.
After the Fed’s policy-inspired volatility, investors are shifting their focus toward the release of the United States Nonfarm Payrolls (NFP) (Jan) data, which will release on Friday. As per the consensus, the US economy has added fresh 185K jobs in January vs. the prior addition of 223K. The Unemployment Rate is seen higher at 3.6%. Also, the Average Hourly Earnings are expected to accelerate to 4.9% from the former release of 4.6%.
Gold technical analysis
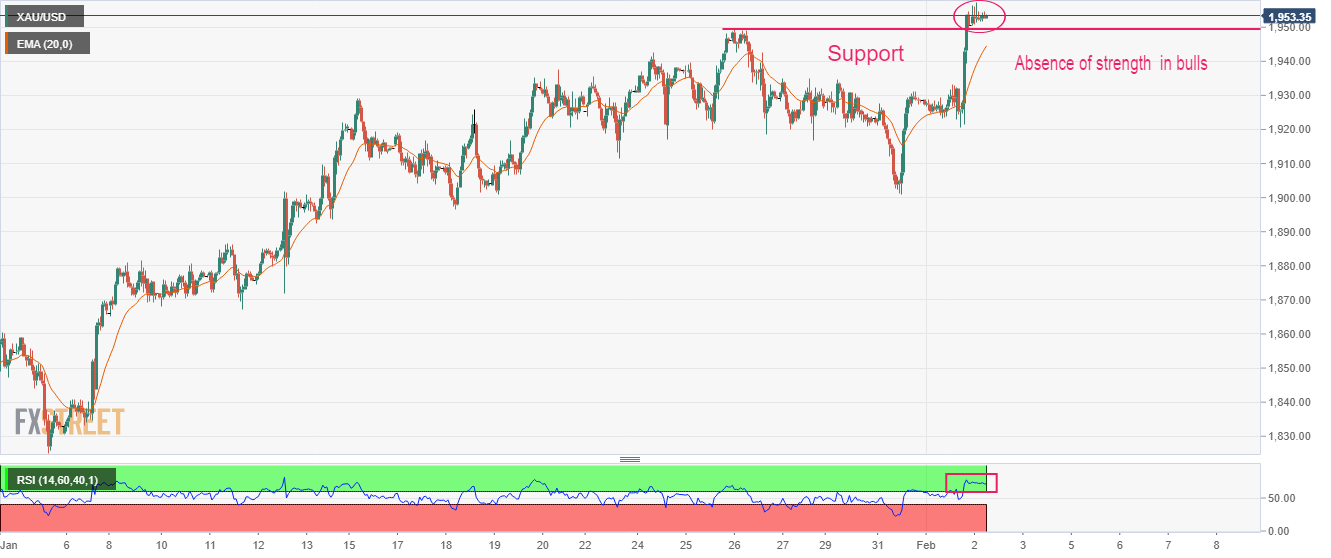
The formation of selling wicks by the Gold price after surpassing January 26 high at $1,949.26 is hinting at the presence of significant offers at elevated levels. It looks like the Gold bulls lack strength for a fresh upside. The 20-period Exponential Moving Average (EMA) at $1,945.00 is still aiming higher, which indicates that the upside trend has not halted yet.
Also, the Relative Strength Index (RSI) is showing signs of an overbought situation, which could result in a minor correction ahead.
Gold hourly chart

© 2000-2026. All rights reserved.
This site is managed by Teletrade D.J. LLC 2351 LLC 2022 (Euro House, Richmond Hill Road, Kingstown, VC0100, St. Vincent and the Grenadines).
The information on this website is for informational purposes only and does not constitute any investment advice.
The company does not serve or provide services to customers who are residents of the US, Canada, Iran, The Democratic People's Republic of Korea, Yemen and FATF blacklisted countries.
Making transactions on financial markets with marginal financial instruments opens up wide possibilities and allows investors who are willing to take risks to earn high profits, carrying a potentially high risk of losses at the same time. Therefore you should responsibly approach the issue of choosing the appropriate investment strategy, taking the available resources into account, before starting trading.
Use of the information: full or partial use of materials from this website must always be referenced to TeleTrade as the source of information. Use of the materials on the Internet must be accompanied by a hyperlink to teletrade.org. Automatic import of materials and information from this website is prohibited.
Please contact our PR department if you have any questions or need assistance at pr@teletrade.global.


