- Analytics
- News and Tools
- Market News
- GBP/USD Price Analysis: Bullish pennant suggests further upside as US GDP looms
GBP/USD Price Analysis: Bullish pennant suggests further upside as US GDP looms
- GBP/USD portrays a bullish chart pattern amid sluggish markets ahead of top-tier US data.
- Sustained break of 1.2410 confirms bullish pennant suggesting further upside toward 1.2550.
- May 2022 peak appears a tough nut to crack for Cable buyers.
- 200-SMA, weekly resistance-turned-support highlights 1.2365 as short-term key support.
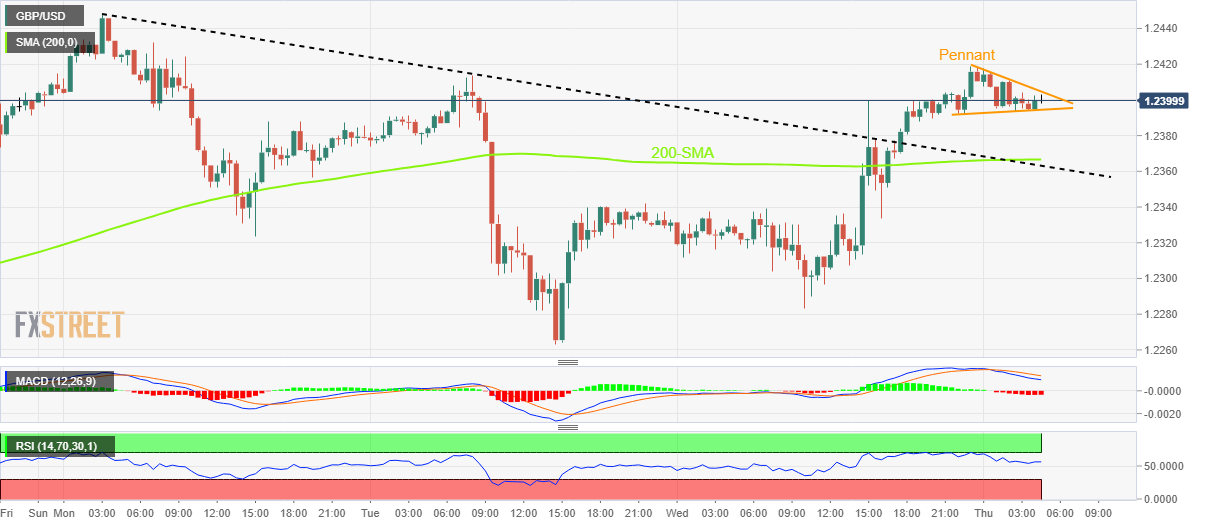
GBP/USD buyers struggle to extend the previous day’s gains around 1.2400 heading into Thursday’s London open. Even so, the quote portrays a bullish chart pattern, namely pennant, as it awaits fresh signals to keep the four-week uptrend intact.
That said, the Cable pair’s latest inaction could be linked to the market’s cautious mood ahead of the first readings of the US fourth quarter (Q4) Gross Domestic Product (GDP), expected to print annualized growth of 2.6% versus 3.2% prior. Also important to watch will be the US Durable Goods Orders for December and the Q4 Personal Consumption Expenditure (PCE) data.
Also read: US Gross Domestic Product Preview: Three reasons to expect a US Dollar-boosting outcome
It should be noted that the steady RSI (14) and the receding bearish bias of the MACD add strength to the optimism surrounding the GBP/USD price upside. Additionally keeping the pair buyers hopeful is the successful upside break of the weekly resistance line, now support, as well as the 200-Simple Moving Average (SMA).
However, a clear upside break of the 1.2410 hurdle becomes necessary for the GBP/USD bulls to keep the reins. Following that, the theoretical target surrounding 1.2550 could lure the Cable buyers. Though, the May 2022 high near 1.2665 could challenge the quote’s further upside.
On the contrary, pullback moves remain elusive until the Cable remains above the stated pennant’s lower line, close to 1.2390 by the press time.
Even if the GBP/USD price breaks the 1.2390 support, the previous resistance line and 200-SMA could challenge the bears around 1.2360.
GBP/USD: 30-minute chart

Trend: Further upside expected
© 2000-2026. All rights reserved.
This site is managed by Teletrade D.J. LLC 2351 LLC 2022 (Euro House, Richmond Hill Road, Kingstown, VC0100, St. Vincent and the Grenadines).
The information on this website is for informational purposes only and does not constitute any investment advice.
The company does not serve or provide services to customers who are residents of the US, Canada, Iran, The Democratic People's Republic of Korea, Yemen and FATF blacklisted countries.
Making transactions on financial markets with marginal financial instruments opens up wide possibilities and allows investors who are willing to take risks to earn high profits, carrying a potentially high risk of losses at the same time. Therefore you should responsibly approach the issue of choosing the appropriate investment strategy, taking the available resources into account, before starting trading.
Use of the information: full or partial use of materials from this website must always be referenced to TeleTrade as the source of information. Use of the materials on the Internet must be accompanied by a hyperlink to teletrade.org. Automatic import of materials and information from this website is prohibited.
Please contact our PR department if you have any questions or need assistance at pr@teletrade.global.


