- Analytics
- News and Tools
- Market News
- Gold Price Forecast: XAU/USD bulls taking on critical equal highs ahead of US CPI
Gold Price Forecast: XAU/USD bulls taking on critical equal highs ahead of US CPI
- Gold Price is moving up but bears are lurking with the United States Consumer Price Index eyed.
- The US Dollar is establishing after meeting seven-month lows and a rebound could be sparked on a higher Consumer Price Index.
- Gold Price test of equal highs and break thereto could be leading the bulls into a trap.
Gold price is trading higher by some 0.3% at the time of writing, after climbing from $1,867.92 to a high of $1,880.79 on the day so far. Gold price bulls have been in charge for several days as the US Dollar met a seven-month low of 102.9 in the prior sessions.
However, traders in Gold price will be mindful of red news on the calendar on Thursday in the United States Consumer Price Index (CPI) that marries up with a potentially technically bearish schematic on the charts as the following analysis, below illustrates. In essence. the bulls could be running into a trap. As analysts at Brown Brothers Harriman explained, who continue to believe markets are underestimating the Federal Reserve; ''it's hard to reconcile a risk rally with deep US yield curve inversion.''
China has been moving Gold price higher
Additionally, analysts at TD Securities argued that ''the strength in gold prices is inconsistent with the bearish macro backdrop, as highlighted by its diverging relationship with real rates.''
The analysts explained that ''under the hood, relentless buying from China has fueled a squeeze on CTA trend follower positioning over the past months, and has yet to show signs of abating.'' The analysts said ''mysterious large-scale Chinese purchases of gold have single-handedly catalyzed a $150/oz rally.''
''Our tracking of positioning for the top ten traders in China highlights a continued accumulation of gold, with this cohort adding another 2.4 tonnes of notional gold to their net length overnight,'' the analysts at TD Securities added.
''CTA trend followers could still exacerbate upside flows with a break north of the $1900/oz mark likely to spark a sizeable buying program equivalent to nearly +8% of algos' maximum historical position size,'' the analysts note explained further in conclusion.
US Dollar bulls emerge on hawkish Federal Reserve officials
Meanwhile, the US Dollar came under modest selling pressure following the Chair of the Federal Reserve (Fed), Jerome Powell, who made unrelated comments at the start of the US session: ''We are not and will not be a climate policymaker''.
However, the DXY index is trading back around 103.25 and is now flat on the day in the middle of the 103.03/49 range. The US Dollar has been recovering from a seven-month low of 102.9 in the prior session as hawkish remarks from Fed policymakers this week so far have sparked a fresh wave of demand for the US Dollar.
On Monday, San Francisco Fed president Mary Daly noted that she expects interest rates to rise beyond 5% in 2023. On the same day, Raphael Bostic argued policymakers should hike above 5% by early in the second quarter and hold rates there for a long time.
US Consumer Price Index could be a catalyst for Gold price
US Treasury bond yields rose ahead of US December inflation data coming Thursday. The report is expected to say inflation rose at an annualized rate of 6.5% last month, down from 7.1% in November. Analysts at TD Securities explained the following:
''We are looking for core prices to have edged higher on a month-on-month basis (MoM) in December, closing out the year on a relatively stronger footing. Indeed, we forecast a firm 0.3% MoM increase, as services inflation likely gained momentum. In terms of the headline, we expect Consumer Price Index (CPI) inflation to register a slight decline on an unrounded basis in December, but rounded up to flat m/m, as energy prices offered large relief again. Our m/m projections imply that headline and core CPI inflation likely lost speed on a year-over-year basis in December.''
For the US Dollar, the analysts said ''unless the core measure significantly surprises to the upside, USD rallies should be sold into. We think the bar is high to compel a reversal of fortune despite the USD tactically stretched.''
Gold price technical analysis
However, Gold price has been moving sideways over the course of several sessions within a three-day bullish impulse. With that being said, on the lower time frames the Gold price is coiled, leading to the assumption that a breakout is imminent, one way or the other and the CPI data could be the trigger to spark a wave of either demand or supply.
Nevertheless, the following technical analysis of the Gold price arrives at a bearish conclusion, at least for the near term.

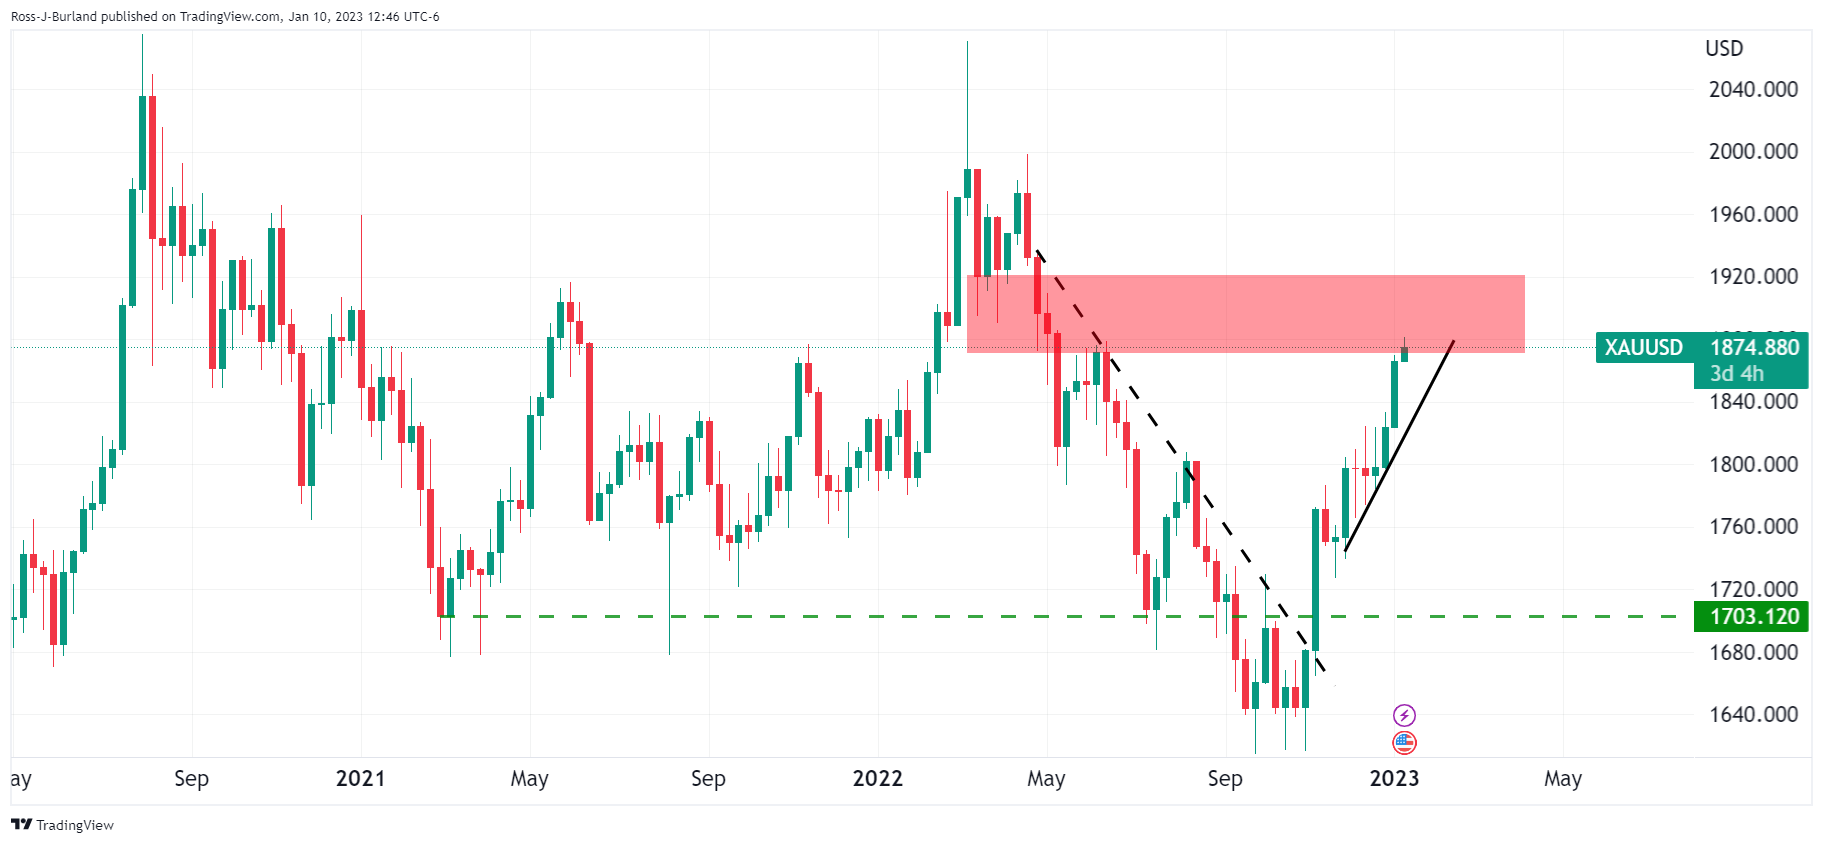
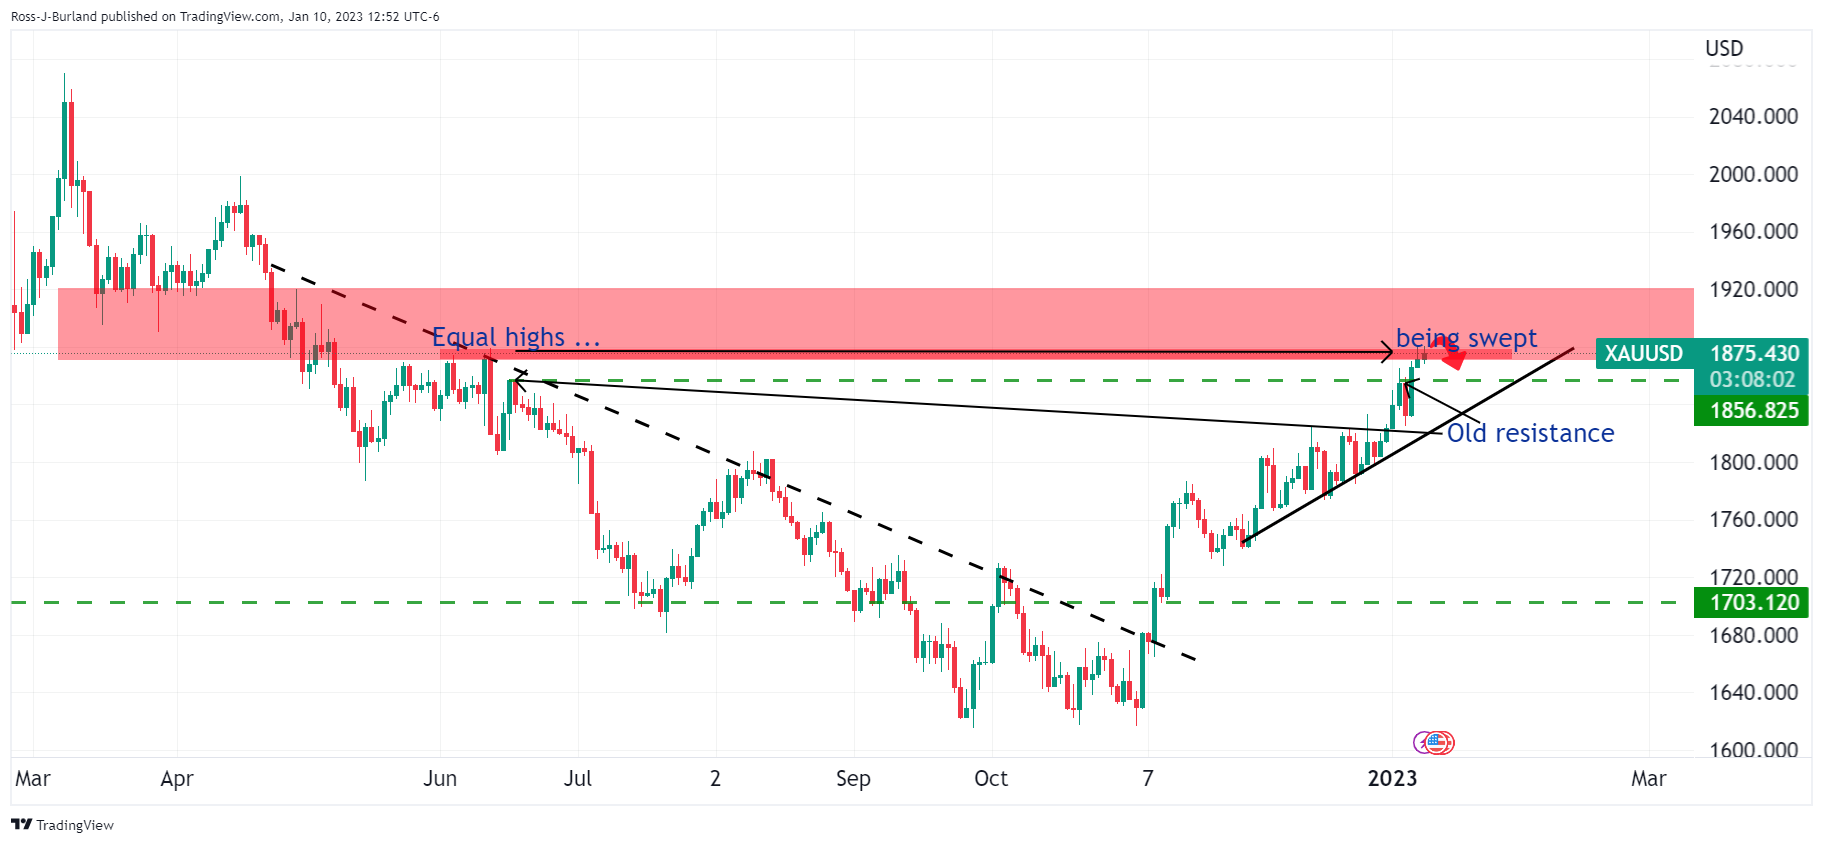
Gold price weekly chart, above, shows Gold running towards $1,880. It is yet to be shown as to whether the market can end this week for a fourth consecutive bullish close. If we move down to the daily Gold price chart, we can see prior equal highs finally being tested and ''swept'' as follows:

This phenomenon occurs on a fractal basis whereby the equal levels are ''swept'' only to fuel a reversal in price. After all, most breakouts fail. So, the following will assume a near-term bearish scenario for the Gold price:

(Gold price daily chart zoomed in, above and below)

As it stands, the current Fibonacci scale drawn on the recent bullish Gold price rally puts the 38.2% ratio in line with prior resistance that would be assumed to act as support for a reversal in the Gold price.

Moving down to the Gold price 4-hour chart, the bears will need to break whatever bullish structure there are that ultimately guards the target area some $23/oz below towards $1,850.
© 2000-2026. All rights reserved.
This site is managed by Teletrade D.J. LLC 2351 LLC 2022 (Euro House, Richmond Hill Road, Kingstown, VC0100, St. Vincent and the Grenadines).
The information on this website is for informational purposes only and does not constitute any investment advice.
The company does not serve or provide services to customers who are residents of the US, Canada, Iran, The Democratic People's Republic of Korea, Yemen and FATF blacklisted countries.
Making transactions on financial markets with marginal financial instruments opens up wide possibilities and allows investors who are willing to take risks to earn high profits, carrying a potentially high risk of losses at the same time. Therefore you should responsibly approach the issue of choosing the appropriate investment strategy, taking the available resources into account, before starting trading.
Use of the information: full or partial use of materials from this website must always be referenced to TeleTrade as the source of information. Use of the materials on the Internet must be accompanied by a hyperlink to teletrade.org. Automatic import of materials and information from this website is prohibited.
Please contact our PR department if you have any questions or need assistance at pr@teletrade.global.


