- Analytics
- News and Tools
- Market News
- Gold Price Forecast: XAU/USD shifts auction above $1,850 as yields drop post FOMC minutes
Gold Price Forecast: XAU/USD shifts auction above $1,850 as yields drop post FOMC minutes
- Gold price has comfortably shifted its business above $1,850.00 on weaker US Manufacturing PMI.
- The risk profile has turned positive as S&P500 sensed buying interest and US yields dropped further.
- A drop in inflation expectations has sensed pressure on the US Dollar Index.
Gold price (XAU/USD) has picked buying interest after a corrective move to near the crucial support of $1,850.00 in the late New York session. The precious metal dropped after failing to sustain above $1,860.00, however, the corrective move is mild and is not showing any significant sign of reversal.
Risk-perceived assets like S&P500 witnessed a decent demand from the market participants after a decline in the United States Manufacturing PMI bolstered signs of further cool-off in the US Consumer Price Index (CPI). A decline in demand for goods might force firms to trim prices at factory goods to compensate for the former.
The US Dollar Index (DXY) dropped below the 104.00 support after 10-year US Treasury yields witnessed immense pressure and scaled down to near 3.69%. Safe-haven assets are facing pressure on expectations of further decline in the inflationary pressures. Federal Reserve (Fed) chair Jerome Powell shifted to a slowdown context in the extent of an interest rate hike in December after remaining aggressive for the entire year. No doubt, the inflation rate is still extremely far from the 2% target, however, the presence of catalysts that advocates further slowdown in the price index is weighing on safe-haven assets.
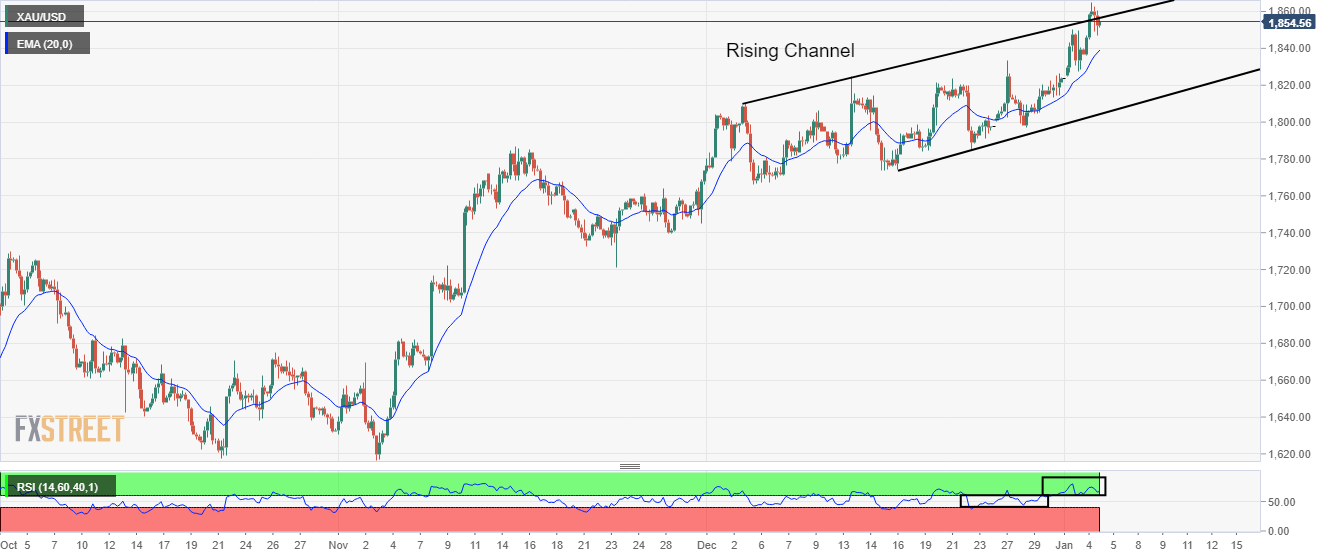
Gold technical analysis
Gold price is attempting to deliver a breakout of the Rising Channel chart pattern on a four-hour scale. The precious metal has delivered a perpendicular rally after picking demand near the round-level support of $1,800.00. The 20-period Exponential Moving Average (EMA) at $1,839.11 is accelerating, which adds to the upside filters.
Meanwhile, the Relative Strength Index (RSI) (14) is oscillating in the bullish range of 60.00-80.00, which indicates that the upside momentum has been triggered.
Gold four-hour chart


© 2000-2026. All rights reserved.
This site is managed by Teletrade D.J. LLC 2351 LLC 2022 (Euro House, Richmond Hill Road, Kingstown, VC0100, St. Vincent and the Grenadines).
The information on this website is for informational purposes only and does not constitute any investment advice.
The company does not serve or provide services to customers who are residents of the US, Canada, Iran, The Democratic People's Republic of Korea, Yemen and FATF blacklisted countries.
Making transactions on financial markets with marginal financial instruments opens up wide possibilities and allows investors who are willing to take risks to earn high profits, carrying a potentially high risk of losses at the same time. Therefore you should responsibly approach the issue of choosing the appropriate investment strategy, taking the available resources into account, before starting trading.
Use of the information: full or partial use of materials from this website must always be referenced to TeleTrade as the source of information. Use of the materials on the Internet must be accompanied by a hyperlink to teletrade.org. Automatic import of materials and information from this website is prohibited.
Please contact our PR department if you have any questions or need assistance at pr@teletrade.global.
transfers