- Analytics
- News and Tools
- Market News
- Gold Price Forecast: XAU/USD struggles to kiss $1,810 as risk-off mood remains solid
Gold Price Forecast: XAU/USD struggles to kiss $1,810 as risk-off mood remains solid
- Gold price is struggling to surpass the crucial resistance of $1,810.00 amid a risk-off mood.
- Fresh stipulations of arrivals from China from various nations are expected to strengthen the US Dollar Index.
- A 40.00-60.00 range oscillation by the RSI (14) is hinting a consolidation ahead.
Gold price (XAU/USD) is facing barricades while attempting to surpass the immediate resistance of $1,810.00 in the Asian session. The precious metal is displaying an intraday inventory adjustment process, which is expected to display volatility expansion. The US Dollar Index (DXY) has displayed a recovery move after a steep correction to near 104.30.
It seems that fresh stipulations of arrivals from China from various nations, citing rising Covid-19 infections responsible for safety measures have improved the safe-haven’s appeal. The US Dollar Index has revived to near 104.40 and is expected to display more upside ahead. S&P500 futures are displaying a lackluster performance as trading activity is getting squeezed amid the festive season.
Meanwhile, 10-year US Treasury yields have corrected marginally to near 3.76% after a three-day rally. China’s Covid-inspired caution in the global markets has trimmed the demand for US government bonds. Going forward, investors will keep an eye on the release of the weekly Initial Jobless Claims data. For the past week, the United States economy reported an increment in fresh claims by 216K.
Gold technical analysis
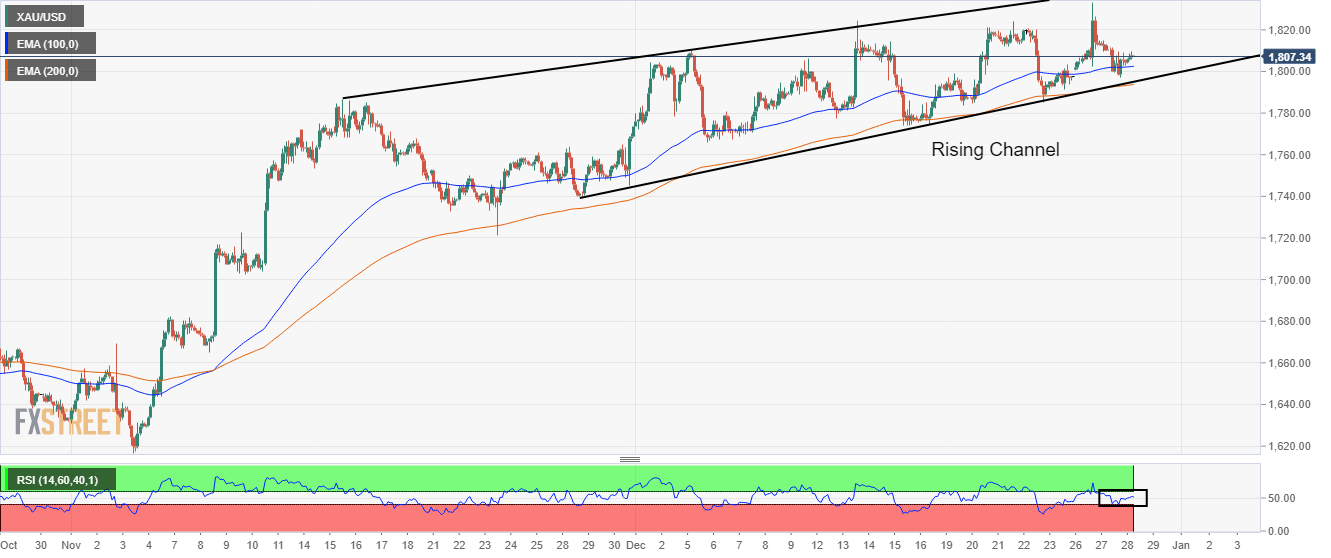
On a two-hour scale, the Gold price is trading in a Rising Channel chart pattern that signals volatility contraction. The upper portion of the aforementioned chart pattern is placed from November 15 high at $1,786.55 while the lower portion is plotted from November 28 low at $1,739.82.
The precious metal has picked strength after dropping to near the 100-period Exponential Moving Average (EMA) at $1,802.20. Also, the 200-EMA at $1,793.35 is aiming higher, which indicates that the upside bias is still solid.
Meanwhile, the Relative Strength Index (RSI) (14) is oscillating in a 40.00-60.00 range, which signals that Gold price is awaiting a fresh trigger for a decisive move.
Gold two-hour chart
© 2000-2026. All rights reserved.
This site is managed by Teletrade D.J. LLC 2351 LLC 2022 (Euro House, Richmond Hill Road, Kingstown, VC0100, St. Vincent and the Grenadines).
The information on this website is for informational purposes only and does not constitute any investment advice.
The company does not serve or provide services to customers who are residents of the US, Canada, Iran, The Democratic People's Republic of Korea, Yemen and FATF blacklisted countries.
Making transactions on financial markets with marginal financial instruments opens up wide possibilities and allows investors who are willing to take risks to earn high profits, carrying a potentially high risk of losses at the same time. Therefore you should responsibly approach the issue of choosing the appropriate investment strategy, taking the available resources into account, before starting trading.
Use of the information: full or partial use of materials from this website must always be referenced to TeleTrade as the source of information. Use of the materials on the Internet must be accompanied by a hyperlink to teletrade.org. Automatic import of materials and information from this website is prohibited.
Please contact our PR department if you have any questions or need assistance at pr@teletrade.global.


